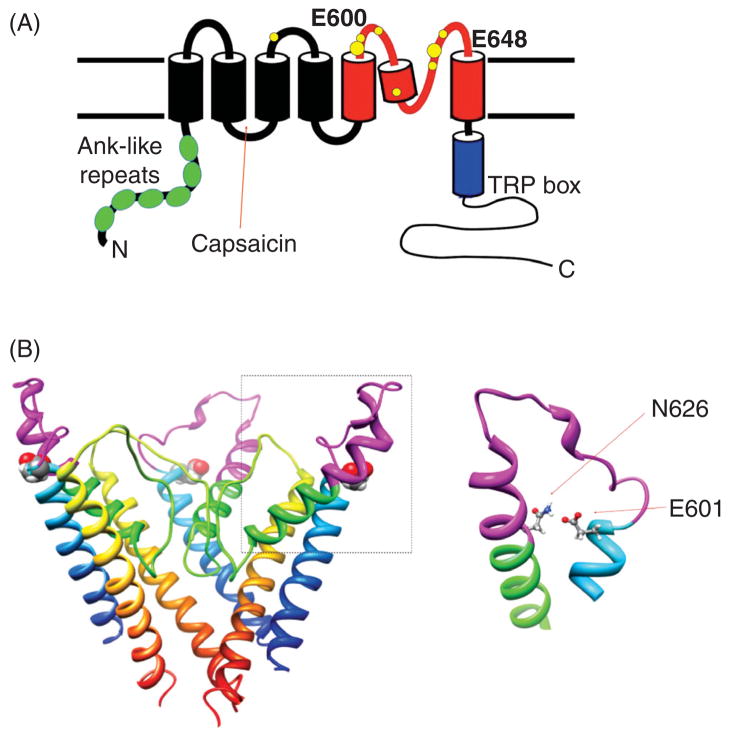
Figure 9.
(A) A topology plot of TRPV1 subunit showing the major pH sites E600 and E648, and other pH sites. (B) (Left panel) A structural model of the mouse TRPV1 channel showing the location of E601 (equivalent to E600 of the rat TRPV1 channel; shown in space-filling mode). (Right panel) Potential interaction between E601 and N626.

