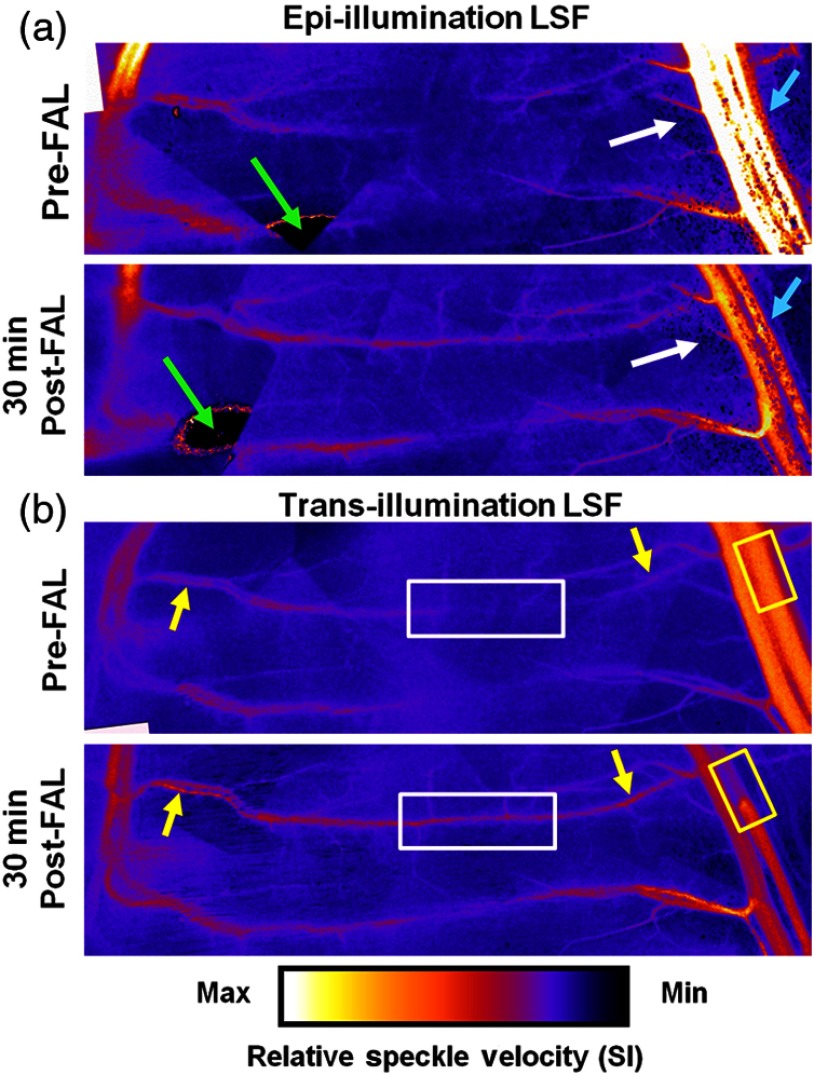
Fig. 4.
Comparison of LSF blood flow maps generated with epi- and trans-illumination. The change from low flow at the entrance regions with a point of convergence in the central regions pre-FAL to high flow continuously across the collateral arteries was apparent in all experiments (). White box: markedly enhanced flow in the central collateral region. Yellow boxes: decreased post-FAL saphenous artery flow. Yellow arrows: enhanced flow in collateral entrance regions evident with trans-illumination. White arrows: noise comparison between epi- and trans-illumination. Cyan arrows: diminished post-FAL saphenous artery flow signal is cleaner with trans-illumination LSF.

