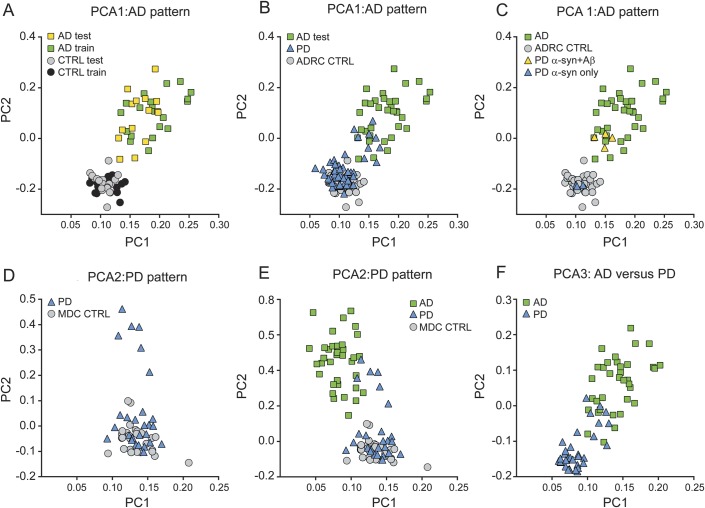
Figure 1. Distribution of principal component analysis component weights across groups.
Scatterplots represent the component weights of the primary principal components (PC1 and PC2) for (A) establishing and validating the Alzheimer disease (AD) Pittsburgh compound B binding pattern (PCA1), (B) the expression of the AD pattern by participants with Parkinson disease (PD), (C) the expression of the AD pattern by participants with PD with autopsy confirmation, (D) comparison of PD and Movement Disorders Center controls (PCA2), (E) the expression of the PD-defined components by the participants with AD, and (F) the direct comparison of participants with PD and participants with AD (PCA3).

