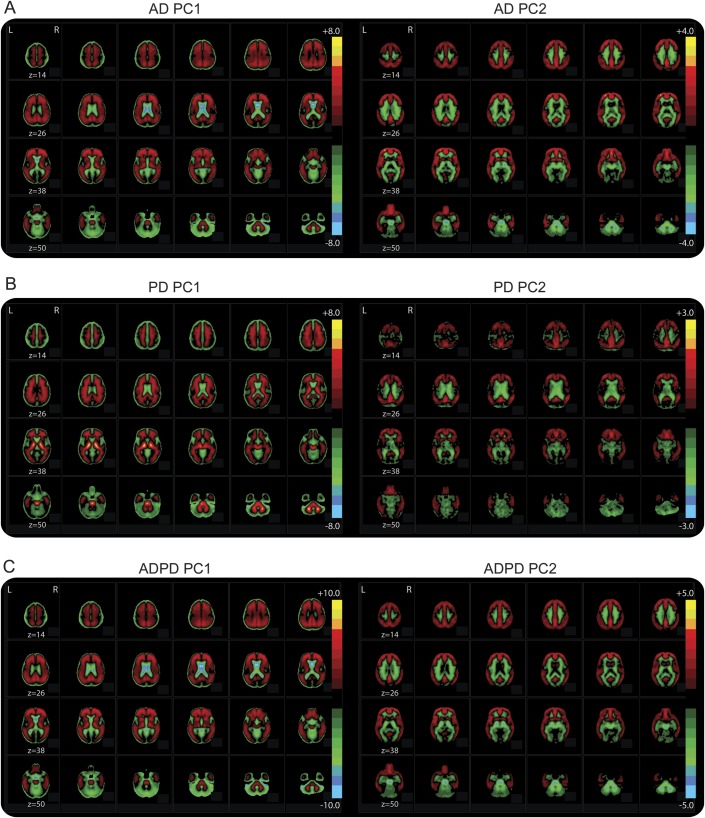
Figure 2. Principal component images.
Images represent the principal components for the (A) comparison of Alzheimer disease (AD) and Alzheimer's Disease Research Center controls (PCA1); (B) comparison of Parkinson disease (PD) and Movement Disorders Center controls (PCA2); (C) comparison of participants with PD and participants with AD (PCA3). The color bar indicates the relative intensities at each voxel for that principal component.

