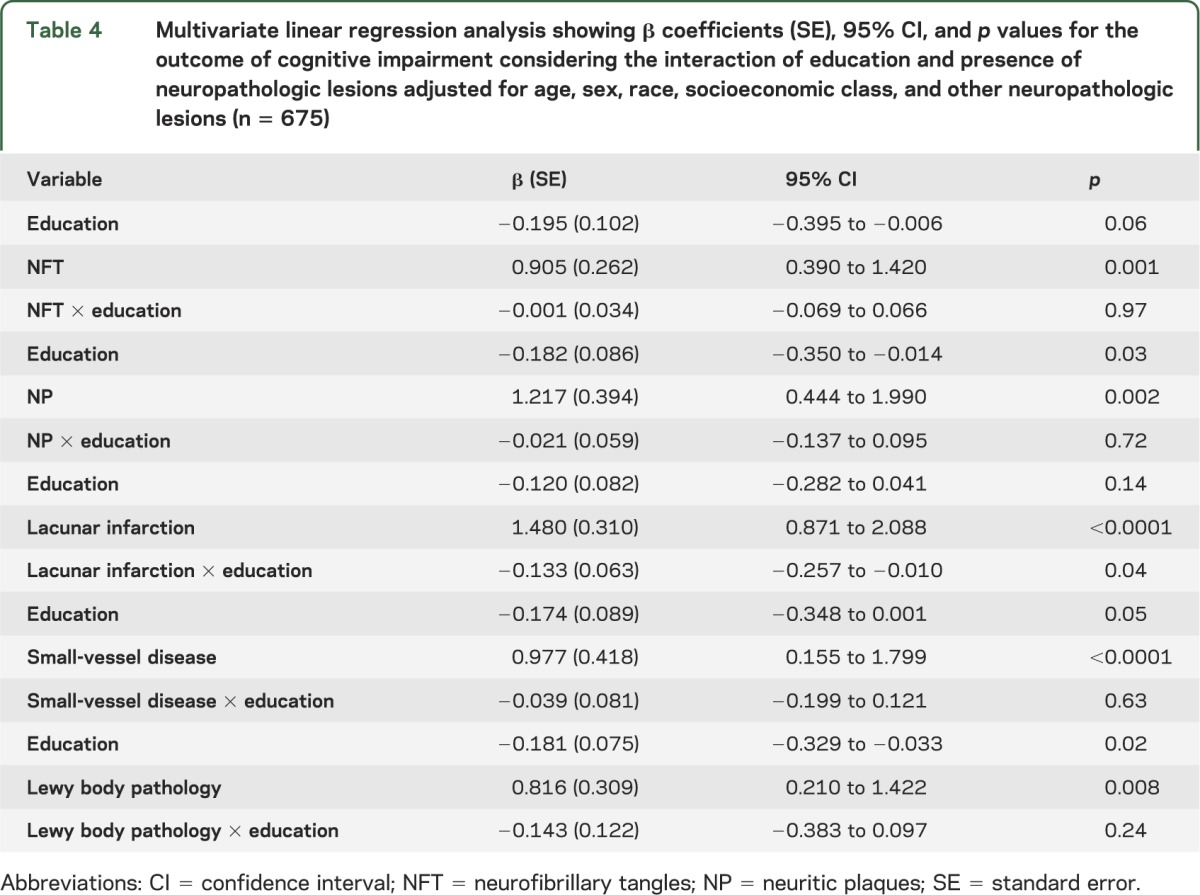
Table 4.
Multivariate linear regression analysis showing β coefficients (SE), 95% CI, and p values for the outcome of cognitive impairment considering the interaction of education and presence of neuropathologic lesions adjusted for age, sex, race, socioeconomic class, and other neuropathologic lesions (n = 675)