Abstract
Objectives:
This was an observational study done on a large cohort of patients with tuberous sclerosis complex (TSC) to determine whether i) the presence of α-[11C]-methyl-l-tryptophan (AMT) hotspots is related to the duration of seizure intractability, ii) the presence of AMT hotspots is related to specific TSC gene mutations, and iii) there is concordance between areas with an AMT hotspot and seizure lateralization/localization on scalp EEG.
Methods:
One hundred ninety-one patients (mean age: 6.7 years; median: 5 years; range: 3 months to 37 years) with TSC and intractable epilepsy were included. All patients underwent AMT-PET scan. AMT uptake in each tuber and normal-appearing cortex was measured and correlated with clinical, scalp EEG, and, if available, electrocorticographic data.
Results:
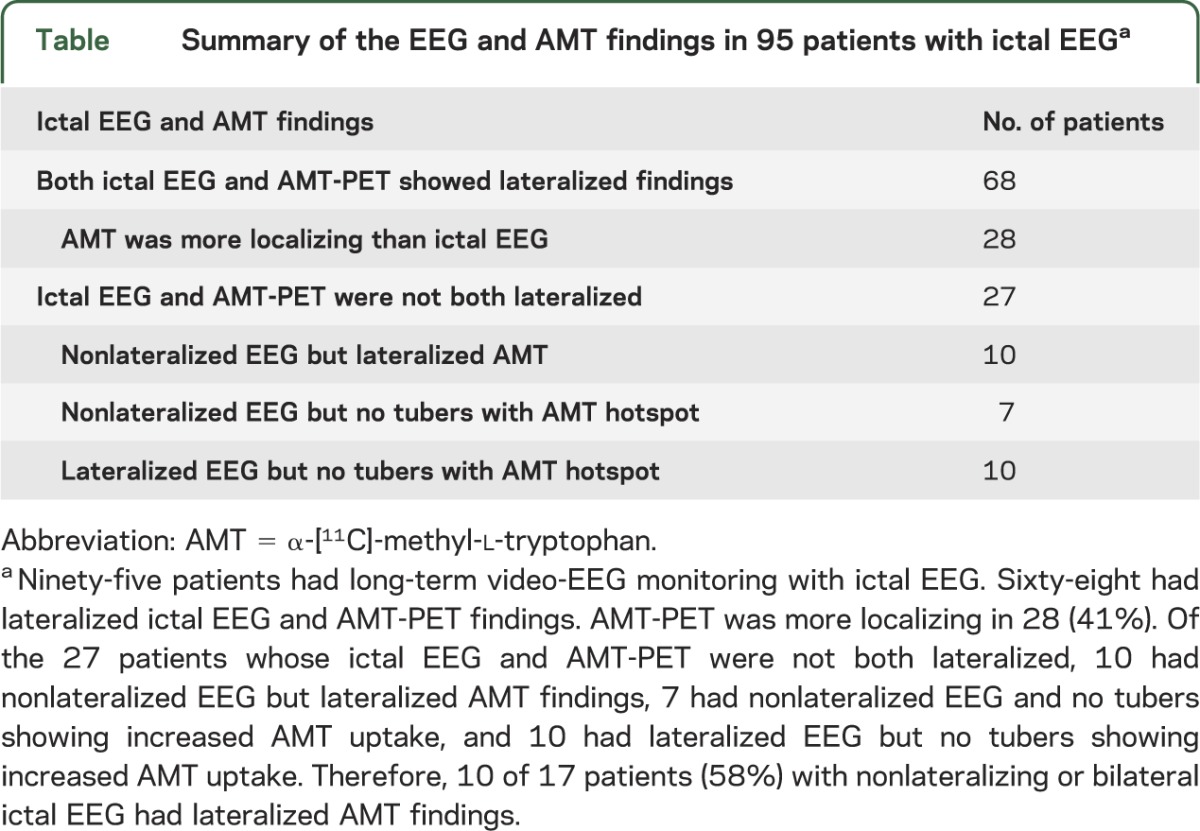
The longer the duration of seizure intractability, the greater the number of AMT hotspots (r = 0.2; p = 0.03). AMT hotspots were seen in both TSC1 and TSC2. There was excellent agreement in seizure focus lateralization between ictal scalp EEG and AMT-PET (Cohen κ 0.94) in 68 of 95 patients in whom both ictal video-EEG and AMT-PET showed lateralizing findings; in 28 of 68 patients (41%), AMT was more localizing. Furthermore, AMT-PET was localizing in 10 of 17 patients (58%) with nonlateralized ictal EEG.
Conclusion:
AMT-PET, when used together with video-EEG, provides additional lateralization/localization data, regardless of TSC mutation. The duration of seizure intractability may predict the multiplicity of areas with AMT hotspots.
Tuberous sclerosis complex (TSC) is a neurocutaneous disorder characterized by multiple cortical tubers, caused by TSC1 gene (hamartin; chromosome 9q34) or TSC2 gene (tuberin; chromosome 16p13.3) mutations. Neurobehavioral problems and tuber numbers are more frequent among patients with the TSC2 than the TSC1 mutation.1–3 Epilepsy is present in most cases, and when medically refractory (60%),4 cognitive outcome is poor.5 Therefore, aggressive treatment, including epilepsy surgery when applicable, is warranted.6–9 However, identifying epileptogenic tubers is challenging because most patients have multiple lesions and multifocal epileptiform abnormalities on scalp EEG. MRI and PET with 2-deoxy-2-(18F)fluoro-d-glucose (FDG) can locate the tubers, but cannot identify the epileptogenic tuber(s). Occasionally, ictal SPECT may show the seizure focus,10 but seizures in children with TSC are often brief and not ideal for ictal SPECT studies. Interictal magnetoencephalography has also been used.11
We previously reported, in a relatively small number of patients with TSC, that α-[11C]-methyl-l-tryptophan (AMT)-PET scanning may differentiate between epileptogenic tubers (high AMT uptake) and nonepileptogenic tubers (low AMT uptake) and that the location of high AMT uptake corresponds to the seizure focus on EEG.6,12,13
The present study was performed in 191 patients with TSC and intractable epilepsy who underwent AMT-PET during epilepsy surgery evaluation to address whether i) presence of increased AMT uptake is related to duration of seizure intractability, ii) increased AMT uptake in epileptogenic tubers is related to specific TSC gene mutations, and iii) there is concordance between areas of increased AMT uptake and seizure lateralization/localization on scalp EEG.
METHODS
Study design.
This was a retrospective, observational study done in a cohort of 191 patients with TSC.
Subjects.
The study group consisted of 191 patients with definite TSC as defined by the Roach criteria14 and intractable epilepsy who had been evaluated at the Children's Hospital of Michigan between November 1996 and July 2012; mean age was 6.7 years (median: 5 years; range: 3 months to 37 years). There were 106 males (56%); 56 (29%) were being treated in our center and 135 (70%) came to Detroit from various epilepsy centers within the United States and from other countries for only the FDG and AMT-PET scans. PET, MRI, and long-term video-EEG recordings were reviewed. Medical records were reviewed for TSC gene mutation, age of seizure onset, duration of seizure intractability, and seizure types. None of the patients took medications affecting tryptophan or serotonin metabolism.
Standard protocol approvals, registration, and patient consents.
The study was approved by the Wayne State University Human Investigation Committee. Written informed consent was obtained from all patients/guardians in compliance with the committee's regulations.
PET scanning.
FDG and AMT-PET studies were performed using either a GE/Discovery/STE PET/CT scanner (GE Healthcare, Waukesha, WI) or a Siemens/CTI EXACT/HR whole-body positron tomograph (Siemens AG, Erlangen, Germany). The procedure for FDG-PET scanning is standard.15 For AMT-PET scans, subjects were fasting for 6 hours to obtain stable plasma tryptophan and large neutral amino acid levels. The plasma tryptophan concentration was measured in the timed blood samples (0.5 mL/sample, collected at 0, 20, 30, 40, 50, and 60 minutes after [11C]AMT injection) by high-pressure liquid chromatography to confirm stable values.16
After AMT (0.1 mCi/kg) injection, a 20-minute dynamic cardiac PET scan was performed (sequence: 12 × 10 seconds, 3 × 60 seconds, and 3 × 300 seconds) in 2-dimensional mode to obtain the left ventricular input function. Continuation of the arterial input function beyond the initial 20 minutes was achieved using the venous blood samples as described previously.17 Subsequently, a dynamic brain scan (7 × 5 minutes) was acquired. Because all subjects received a standardized weight-based dose, the calibrated images (μCi/mL) directly depicted the standardized uptake value.18 Children were sedated using either IV pentobarbital (3 mg/kg) or midazolam (0.2–0.4 mg/kg) and fentanyl (1 μg/kg; maximum 50 μg) when necessary. Prior studies performed on 5 normal adults each scanned twice (with/without sedation using midazolam) found no significant difference in AMT uptake (Chugani et al., unpublished data, 1995).
The FDG- and AMT-PET scans were performed on different days. Scalp EEG was monitored continuously during the FDG-uptake period. Scalp EEG was not monitored during AMT-PET because the continuous scanning required sedation in most cases, which would affect the EEG interpretation. However, patients were carefully monitored for clinical seizures.
Definition of cortical tubers and dysplastic cortex.
Cortical tubers and dysplastic cortex were visually identified using fluid-attenuated inversion recovery (FLAIR), T2-weighted, and FDG-PET images. As previously described,6 cortical nodular lesions that were hyperintense or heterointense with calcification on FLAIR or T2-weighted and seen as focal nodular cortical hypometabolism on FDG-PET images were counted as cortical tuber. Dysplastic cortices were defined as focal thickening of the cortex, with blurred gray white-matter junction, and these regions would correspond to cortical glucose hypometabolism on FDG-PET. Cortical areas that were hypometabolic on FDG-PET but equivocal on MRI were considered dysplastic.
Regions of interest.
Regions of interest for cortical tubers and dysplastic cortices and contralateral homotopic normal-appearing cortex were delineated using a semiautomated threshold-based software program.13 Briefly, the AMT-PET images were coregistered to FLAIR, T2-weighted, and FDG images using MPITOOL (Max-Planck Institute, Cologne, Germany)19 (figure 1), and AMT uptake in each tuber and normal-appearing cortex was measured. Increased AMT uptake in the caudate nucleus and cerebellum was excluded. An AMT uptake ratio (AMT uptake in cortical tubers divided by AMT uptake in normal-appearing cortex) of >1.0 was considered increased AMT uptake or an AMT hotspot. This cutoff is based on previous studies using receiver operating characteristic analysis showing that an AMT uptake ratio of >0.98 resulted in statistically significant detection of epileptogenic tubers with specificity = 0.91.13 Because nonepileptogenic tubers show lower AMT uptake than normal cortex, the uptake ratio of such tubers would be much less than 1.0.
Figure 1. FLAIR MRI, FDG-PET, and AMT-PET scans of a boy with TSC2, multiple tubers, and intractable epilepsy.
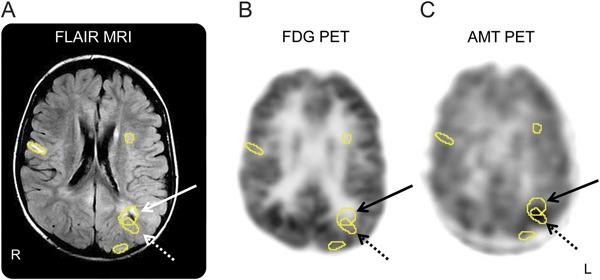
FLAIR MRI (A), FDG-PET (B), and AMT-PET (C) scans in a 4-year-old boy with TSC2 mutation, multiple tubers (see Regions of interest), intractable seizures, and nonlocalizing scalp EEG. AMT-PET shows increased AMT uptake in a left parietal tuber (solid arrow), particularly in its posterior margin and adjacent cortex (dashed arrow). Increased AMT uptake is frequently observed at one of the edges of the epileptic tuber with some involvement of adjacent apparently normal cortex. AMT = α-[11C]-methyl-l-tryptophan; FDG = 2-deoxy-2-(18F)fluoro-d-glucose; FLAIR = fluid-attenuated inversion recovery
Long-term scalp video-EEG.
Ninety-five patients had long-term scalp video-EEG recordings that captured seizures. Thirty-eight (40%) were performed in our institution; 57 (60%) were performed in other centers but only 10 of these EEG tracings were available for review. Seizure focus lateralization from the interictal and ictal scalp EEG data was determined.
Epilepsy surgery patients.
Thirty-seven of 191 patients underwent epilepsy surgery in our center. Thirty-two had 2-stage epilepsy surgery with extraoperative electrocorticographic (ECoG) recordings and 5 had 1-stage surgery. Each case was discussed in our epilepsy surgery planning meeting. In addition to the subdural grid electrode's placement being guided by the standard epilepsy-surgery approach (i.e., seizure semiology, long-term video-EEG monitoring, MRI and FDG-PET scans, and neuropsychological evaluation), grid placement was also influenced by the AMT-PET data. More specifically, to determine whether the areas of AMT hotspot corresponded to ictal onset zones, the AMT hotspots were also covered with subdural EEG electrodes.
All AMT hotspots as well as tubers/dysplastic cortex without hotspots (AMT cold) (if located in the same hemisphere and if surgically feasible) were covered with subdural EEG electrodes. The AMT hotspots that showed seizure-onset zone, rapid spread, or frequent interictal spiking on subdural EEG were resected as long as they did not involve the eloquent cortex. Patients with multiple and bilateral AMT hotspots were still considered for surgery if ictal EEG on video-EEG monitoring was lateralized to one hemisphere. We currently monitor whether an unresected tuber with increased AMT uptake in the contralateral hemisphere will have a greater chance of evolving into a new and independent seizure focus after the surgery. If the patient had multiple and bilateral AMT hotspots and associated bilateral seizure onset on long-term video-EEG, surgery was not offered unless for palliative purpose.
Statistical analysis.
Quantitative values are expressed as mean ± SD whereas qualitative values are given as numbers or percentages. Because the duration of seizure intractability did not follow a normal distribution, nonparametric tests were performed to determine whether there was correlation between the duration of seizure intractability and the presence or absence of AMT hotspots and with the number of AMT hotspots. The association between seizure types and the presence or absence of infantile spasms with the presence of AMT hotspots was also determined. To determine whether there was an agreement between areas of increased AMT uptake and seizure lateralization/localization on scalp EEG, Cohen κ coefficient was determined. SPSS 18.0 (SPSS Inc., Chicago, IL) was used for data analysis.
RESULTS
Clinical and genetic data.
There were 106 males (56%); mean age of seizure onset (when available; n = 134) was 15 months (range: birth to 32 years; SD: 3.25 years; median: 5 months). Mean duration of seizure intractability (n = 128) was 5.5 years (range: 3 months to 28 years; SD: 5 years; median: 4 years). Only 55 of the 191 patients had TSC genetic testing data available because of insurance denial and/or excessive copay. Thirty-seven had TSC2 mutation, 5 had TSC1 mutation, 10 showed negative results, and 3 showed inconclusive results.
Seizure types.
Of 153 patients with known seizure types, 133 (87%) had intractable complex partial seizures: 40 with complex partial seizures alone and 93 with other seizure types, including infantile spasms in 26, generalized seizures in 41, and infantile spasms as well as generalized seizures in 26 patients. Sixteen of the 153 (10%) had infantile spasms alone, and 4 fulfilled criteria for Lennox-Gastaut syndrome. There was no association between specific seizure types or presence of infantile spasms with the presence of AMT hotspots.
AMT hotspots and location.
Of the 191 patients, 146 (76%) had AMT hotspots in 1 (n = 65), 2 (n = 43), 3 (n = 22), or >3 (n = 16) cortical tubers, dysplastic cortex, and/or in the cortex adjacent to the tuber. We have observed that in the above 146 patients, 4 categories of the locations of AMT hotspots were noted: 1) cortical tuber in 96 patients, 2) dysplastic cortex remote from the tuber in 21, 3) tuber margin plus adjacent cortex in 5, and 4) cortex adjacent to AMT cold tuber in 8. In the remaining 16 patients, a combination of the above 4 patterns was seen.
TSC gene mutation.
The χ2 test showed no sex differences for increased AMT uptake. AMT hotspots occurred in both TSC1 and TSC2 patients, and also in those with negative and inconclusive genetic results (figure 2). There was no significant difference in the proportion of TSC1 and TSC2 patients with and without AMT hotspots or in the proportion of TSC2 and non-TSC2 patients (TSC1 and negative mutation) with and without AMT hotspots.
Figure 2. AMT-PET scans of patients with TSC1 and TSC2 mutations and intractable seizures.
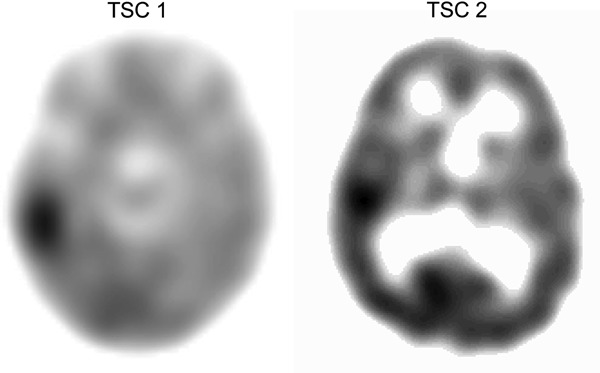
AMT-PET scans of patients with TSC1 and TSC2 demonstrating increased AMT uptake or “AMT hotspot.” AMT = α-[11C]-methyl-l-tryptophan.
Duration of intractable epilepsy.
Patients showing AMT hotspots had longer mean (69 vs 54 months) and median (52 vs 30 months) duration of seizure intractability than those without, but without reaching statistical significance. The number of cortical tubers/dysplastic cortex showing an AMT hotspot increased with the median duration of epilepsy intractability (r = 0.2; p = 0.03) using Spearman correlation analysis (figure 3).
Figure 3. Association of AMT hotspots with median duration of seizure intractability.
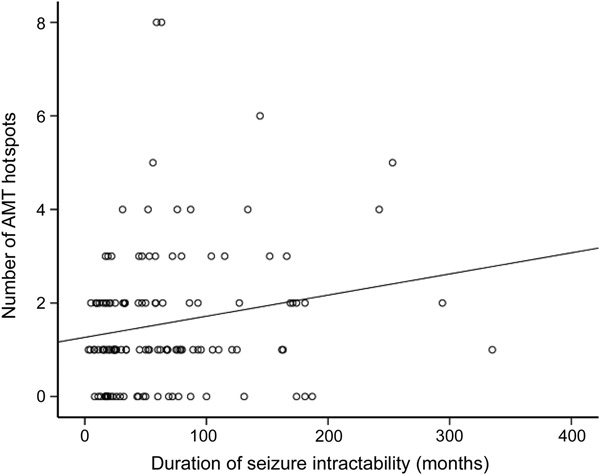
The number of cortical tubers/dysplastic cortex showing AMT hotspots increased with the median duration of epilepsy intractability (r = 0.2; p = 0.03) using Spearman correlation analysis. AMT = α-[11C]-methyl-l-tryptophan.
Seizure focus lateralization.
Among the 95 patients who had long-term video-EEG monitoring, 68 had lateralized ictal EEG and AMT findings with almost perfect agreement in seizure focus lateralization (Cohen κ 0.94). However, AMT-PET was more localizing than EEG in 28 (41%) of the 68 patients, allowing more precise guidance for intracranial electrode placements (figure 4). Of the remaining 27 (with ictal EEG), 10 showed nonlateralized ictal EEG but lateralized AMT-PET, 7 failed to lateralize on both, and 10 showed lateralization on EEG but not AMT-PET. In other words, 10 of 17 patients (58%) with nonlateralizing ictal EEG showed lateralized AMT-PET, but conversely, in 10 patients, ictal EEG was more useful than AMT-PET (table).
Figure 4. Scalp EEG, FDG, AMT, and 3-dimensional MRIs of a boy with TSC2 and intractable seizures.
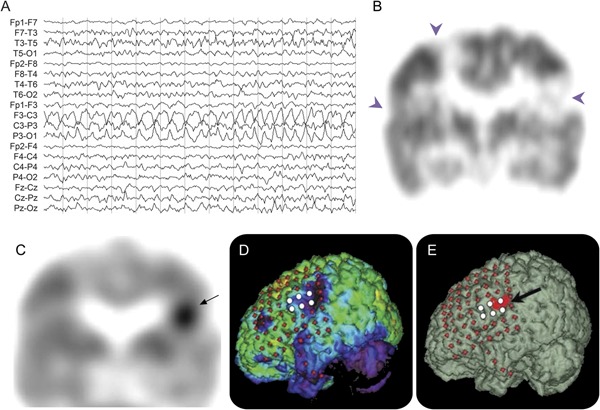
Scalp ictal EEG (A), FDG (B), and AMT (C) PET scans of a 1-year-old boy with TSC2 gene mutation and intractable partial seizures. (A) Scalp ictal EEG showed rhythmic sharply contoured slow-wave activity arising from the left hemisphere with involvement of midline electrodes. (B) Interictal coronal FDG-PET scan showed multifocal and bilateral hypometabolic regions representing the cortical tubers (arrowheads). (C) A single area of increased AMT uptake in the left inferior lateral parietal region (arrow) can be seen. The patient underwent 2-stage surgery. Three-dimensional reconstructed surface MRIs superimposed with subdural electrodes are shown in D and E. (D) Glucose hypometabolic areas are indicated by violet areas in the left inferior parietal and frontal regions. (E) Increased AMT uptake (indicated in red) in the left inferior parietal region (arrow). Ictal subdural EEG recording showed seizure onset (white electrodes) originating from the left primary sensory face area. The child was seizure-free after surgery (follow-up 4 years). AMT = α-[11C]-methyl-l-tryptophan; FDG = 2-deoxy-2-(18F)fluoro-d-glucose.
Table.
Summary of the EEG and AMT findings in 95 patients with ictal EEGa
Epilepsy surgery was performed in our institution on 37 of the 191 patients. Surgical resection was guided by combined localizing information from long-term video-EEG monitoring, neuroimaging, and neuropsychological data. Thirty-two underwent a 2-stage epilepsy surgery with extraoperative ECoG recordings whereas 5 underwent a 1-stage resection with intraoperative ECoG. In those undergoing 2-stage procedures, ECoG data and AMT-PET findings dictated the extent of resection, targeting areas involved in seizure onset, rapid seizure spread, and showing frequent repetitive interictal spiking, unless they occurred in eloquent regions.
In 24 of the 32 patients undergoing 2-stage surgery, the areas showing AMT hotspots corresponded to the ECoG findings of seizure onset, rapid seizure spread, or frequent repetitive spiking. In 5 patients, no AMT hotspot was noted. In 2 patients, the area showing an AMT hotspot did not correspond to the ECoG findings. One patient had status epilepticus after electrode placement, developed increased intracranial pressure, and died from brainstem herniation. Seizures leading to elevation of intracranial pressure during invasive EEG recording have been previously reported.20
Thirty-three of the 37 patients had available surgery outcome data (mean follow-up: 40 months; range: 7–120 months; SD: 29; median: 38). Nineteen patients became seizure-free (17 with Engel class IA and 2 with Engel class IB); 2 had Engel class II including one who was seizure-free for 18 months with subsequent rare seizures (class IIC). Seven had Engel class IIIA and 5 had Engel class IVA outcomes.
Even among the 12 patients with Engel class III or IV outcomes, surgery provided a period (7–60 months; mean 31.6 months) of seizure freedom in 5 patients; indeed, 3 were seizure-free for >3 years before seizures recurred. One patient had right frontal resection and became seizure-free for 60 months before relapse. Repeat scalp video-EEG showed a contralateral frontal seizure focus. A second patient who underwent left frontoparietal resection also showed a contralateral right temporal tuber (AMT uptake ratio 1.024), which was electrographically silent. The resected left frontoparietal tuber (AMT uptake ratio 1.107) corresponded to seizure onset on both scalp and subdural EEG. In a third patient, the resected left frontotemporal tuber did not show an AMT hotspot, but a contralateral right temporal tuber had an AMT uptake ratio of 1.05 and showed interictal epileptiform discharges on scalp video-EEG; however, because the majority of seizures originated from the left frontotemporal region, a palliative left frontotemporal resection was performed. A fourth patient had seizures that were difficult to lateralize. The fifth patient had a follow-up video-EEG, but, unfortunately, seizures were not captured.
Of the remaining 7 patients with either class III or IV outcome, 3 had incompletely resected AMT hotspots because of proximity to eloquent cortex, and one had a suboptimal resection because of heavy tuber burden in the contralateral homotopic area. Of the remaining 3 (2 with Lennox-Gastaut syndrome), surgery was performed as a palliative procedure, i.e., to improve quality of life realizing that seizure freedom was not achievable.
DISCUSSION
The present study involving a large cohort of patients with TSC and intractable epilepsy showed that the longer the duration of seizure intractability, the greater the number of AMT hotspots. There was a trend toward longer duration of seizure intractability among patients with AMT hotspots compared with those without. An excellent agreement in seizure focus lateralization from ictal scalp EEG and AMT-PET was demonstrated. Our results are consistent with previous smaller studies demonstrating that epileptogenic tubers frequently show increased AMT uptake.6,12,13,21 The incremental value of AMT-PET over standard investigations is illustrated by i) 10 of 17 patients (58%) with nonlateralizing ictal scalp EEG but lateralized increased AMT-PET uptake, and ii) 28 of 68 patients (41%) whose ictal EEG was lateralizing but nonlocalizing in whom AMT-PET provided localizing information to guide placement of intracranial electrodes. Our findings suggest that AMT-PET could provide additional lateralization/localization data to the standard modalities in the pre-epilepsy surgical evaluation of patients with TSC.
The underlying mechanism of increased AMT uptake in epileptogenic tubers is poorly understood; however, increased tryptophan metabolism via the kynurenine pathway within epileptogenic tubers has been proposed.22 Normally, tryptophan is primarily metabolized to protein and serotonin and is minimally metabolized through the kynurenine pathway. In the presence of ischemic and neuroinflammatory states, the kynurenine pathway becomes activated via induction of indoleamine 2,3-dioxygenase (the rate-limiting enzyme) leading to production of proconvulsants, including quinolinic acid, a neurotoxic NMDA excitatory receptors agonist.22,23 Indeed, cortical tubers express inflammatory markers.24 We have found a 5-fold-higher concentration of quinolinic acid in cortical tubers showing high AMT uptake (i.e., epileptogenic tubers) compared with tubers with low AMT uptake.25 In the present study, we demonstrated that the longer the seizure intractability duration, the more AMT hotspots seen. We hypothesize that chronic epileptic activity can further induce neuroinflammation in cortical tubers and/or dysplastic cortex in TSC.
The mechanisms accounting for these relationships are unclear, but age-related cellular degeneration within tubers may have a role. Although cortical tubers were previously believed to be static lesions resulting from abnormal cortical morphogenesis due to TSC gene mutations, recent reports suggest that tubers evolve over time,26,27 such that some tubers may undergo cystic and calcific degeneration. Tuber astrogliosis may also change from reactive to gliotic28 suggesting its dynamic nature. The variable MRI appearance of tubers in infants compared with older children further supports their dynamic nature.29
It has been suggested that neurobehavioral problems and tuber numbers are more frequent among patients with the TSC2 mutation than in those with TSC1. Because of this notion, we attempted to determine whether the presence of AMT hotspots differed between TSC1 and TSC2 or between TSC2 and non-TSC2 patients (TSC1 and negative mutation), but we found no statistically significant differences between groups. The result was, however, limited by small sample size because only 55 patients had genetic testing and only 5 had TSC1. Therefore, a definite conclusion cannot be made about any association between AMT hotspots and TSC genetic mutation.
The present study on a large cohort also reported an expansion of a smaller study6 focused on epilepsy surgery outcome for TSC performed in our institution. Nineteen patients in the present study became seizure-free and 2 had rare disabling seizures. Even among the 12 patients who had either Engel class IIIA or IV, 5 achieved a significant period of seizure freedom (3 patients for >3 years) before seizures recurred. The temporary relief from severe epilepsy during an early period of brain development was still beneficial. Therefore, epilepsy surgery benefited 26 of 33 patients (78%) in our series. The later seizure recurrence in the patients with TSC may be related to transformation of a quiescent nonepileptogenic tuber into an epileptogenic one, a well-known phenomenon in TSC, again supporting the dynamic nature of cortical tubers.
The major limitation of this study is its retrospective nature. The majority of patients were from outside institutions and we were unable to determine whether AMT-PET added further information in their presurgical evaluation because various centers place different emphases on presurgical tools. Another limitation is the lack of the ideal gold standard of intracranial EEG in most of our patients. However, in our previous smaller study,6 we found a specificity of 84% for focally increased AMT uptake to detect the epileptogenic tuber. Finally, the small number of patients who underwent gene testing is also a weakness and, indeed, some of the testing was done several years ago when the technology may have been less sensitive.
GLOSSARY
- AMT
α-[11C]-methyl-l-tryptophan
- ECoG
electrocorticographic
- FDG
2-deoxy-2-(18F)fluoro-d-glucose
- FLAIR
fluid-attenuated inversion recovery
- TSC
tuberous sclerosis complex
AUTHOR CONTRIBUTIONS
H.T.C.: study concept and design, analysis and interpretation of data, manuscript preparation, and study supervision. A.F.L.: analysis and interpretation of data, manuscript preparation. A.K. and R.G.: acquisition, analysis, and interpretation of data, manuscript preparation. K.P.: acquisition of data, manuscript preparation. E.A.: acquisition, analysis, and interpretation of data, manuscript preparation.
STUDY FUNDING
Supported by NIH grant ROI-NS064989 to H.T.C.
DISCLOSURE
H. Chugani volunteers on the professional advisory board of the Tuberous Sclerosis Alliance. He is funded by NIH grant ROI-NS064989. A. Luat, A. Kumar, R. Govindan, and K. Pawlik report no disclosures. E. Asano has been funded by NIH grants K23-047550 and ROI-064033. Go to Neurology.org for full disclosures.
REFERENCES
- 1.Jones AC, Daniells CE, Snell RG, et al. Molecular genetic and phenotypic analysis reveals differences between TSC1 and TSC2 associated familial and sporadic tuberous sclerosis. Hum Mol Genet 1997;6:2155–2161 [DOI] [PubMed] [Google Scholar]
- 2.Dabora SL, Jozwiak S, Franz DN, et al. Mutational analysis in a cohort of 224 tuberous sclerosis patients indicates increased severity of TSC2, compared with TSC1, disease in multiple organs. Am J Hum Genet 2001;68:64–80 [DOI] [PMC free article] [PubMed] [Google Scholar]
- 3.Doherty C, Goh S, Young Poussaint T, Erdag N, Thiele EA. Prognostic significance of tuber count and location in tuberous sclerosis complex. J Child Neurol 2005;20:837–841 [DOI] [PubMed] [Google Scholar]
- 4.Chu-Shore CJ, Major P, Camposano S, Muzykewicz D, Thiele EA. The natural history of epilepsy in tuberous sclerosis complex. Epilepsia 2010;51:1236–1241 [DOI] [PMC free article] [PubMed] [Google Scholar]
- 5.Winterkorn EB, Pulsifer MB, Thiele EA. Cognitive prognosis of patients with tuberous sclerosis complex. Neurology 2007;68:62–64 [DOI] [PubMed] [Google Scholar]
- 6.Kagawa K, Chugani DC, Asano E, et al. Epilepsy surgery outcome in children with tuberous sclerosis complex evaluated with alpha-[11C]methyl-L-tryptophan positron emission tomography (PET). J Child Neurol 2005;20:429–438 [DOI] [PubMed] [Google Scholar]
- 7.Weiner HL, Carlson C, Ridgway EB, et al. Epilepsy surgery in young children with tuberous sclerosis: results of a novel approach. Pediatrics 2006;117:1494–1502 [DOI] [PubMed] [Google Scholar]
- 8.Jansen FE, van Huffelen AC, Algra A, van Nieuwenhuizen O. Epilepsy surgery in tuberous sclerosis: a systematic review. Epilepsia 2007;48:1477–1484 [DOI] [PubMed] [Google Scholar]
- 9.Wu JY, Salamon N, Kirsch HE, et al. Noninvasive testing, early surgery, and seizure freedom in tuberous sclerosis complex. Neurology 2010;74:392–398 [DOI] [PMC free article] [PubMed] [Google Scholar]
- 10.Koh S, Jayakar P, Dunoyer C, et al. Epilepsy surgery in children with tuberous sclerosis complex: presurgical evaluation and outcome. Epilepsia 2000;41:1206–1213 [DOI] [PubMed] [Google Scholar]
- 11.Kamimura T, Tohyama J, Oishi M, et al. Magnetoencephalography in patients with tuberous sclerosis and localization-related epilepsy. Epilepsia 2006;47:991–997 [DOI] [PubMed] [Google Scholar]
- 12.Chugani DC, Chugani HT, Muzik O, et al. Imaging epileptogenic tubers in children with tuberous sclerosis complex using alpha-[11C]methyl-L-tryptophan positron emission tomography. Ann Neurol 1998;44:858–866 [DOI] [PubMed] [Google Scholar]
- 13.Asano E, Chugani DC, Muzik O, et al. Multimodality imaging for improved detection of epileptogenic foci in tuberous sclerosis complex. Neurology 2000;54:1976–1984 [DOI] [PubMed] [Google Scholar]
- 14.Roach ES, Gomez MR, Northrup H. Tuberous sclerosis complex consensus conference: revised clinical diagnostic criteria. J Child Neurol 1998;13:624–628 [DOI] [PubMed] [Google Scholar]
- 15.Chugani HT, Phelps ME, Mazziotta JC. Positron emission tomography study of human brain functional development. Ann Neurol 1987;22:487–497 [DOI] [PubMed] [Google Scholar]
- 16.Wolf WA, Kuhn DM. Uptake and release of tryptophan and serotonin: an HPLC method to study the flux of endogenous 5-hydroxyindoles through synaptosomes. J Neurochem 1986;46:61–67 [DOI] [PubMed] [Google Scholar]
- 17.Muzik O, Chugani DC, Chakraborty P, Mangner T, Chugani HT. Analysis of [C-11]alpha-methyl-tryptophan kinetics for the estimation of serotonin synthesis rate in vivo. J Cereb Blood Flow Metab 1997;17:659–669 [DOI] [PubMed] [Google Scholar]
- 18.Chugani DC, Muzik O, Chakraborty P, Mangner T, Chugani HT. Human brain serotonin synthesis capacity measured in vivo with alpha-[C-11]methyl-L-tryptophan. Synapse 1998;28:33–43 [DOI] [PubMed] [Google Scholar]
- 19.Pietrzyk U, Herholz K, Fink G, et al. An interactive technique for three-dimensional image registration: validation for PET, SPECT, MRI and CT brain studies. J Nucl Med 1994;35:2011–2018 [PubMed] [Google Scholar]
- 20.Shah AK, Fuerst D, Sood S, et al. Seizures lead to elevation of intracranial pressure in children undergoing invasive EEG monitoring. Epilepsia 2007;48:1097–1103 [DOI] [PubMed] [Google Scholar]
- 21.Fedi M, Reutens DC, Andermann F, et al. alpha-[11C]-Methyl-L-tryptophan PET identifies the epileptogenic tuber and correlates with interictal spike frequency. Epilepsy Res 2003;52:203–213 [DOI] [PubMed] [Google Scholar]
- 22.Chugani DC. alpha-Methyl-L-tryptophan: mechanisms for tracer localization of epileptogenic brain regions. Biomark Med 2011;5:567–575 [DOI] [PMC free article] [PubMed] [Google Scholar]
- 23.Saito K, Nowak TS, Jr, Suyama K, et al. Kynurenine pathway enzymes in brain: responses to ischemic brain injury versus systemic immune activation. J Neurochem 1993;61:2061–2070 [DOI] [PubMed] [Google Scholar]
- 24.Boer K, Jansen F, Nellist M, et al. Inflammatory processes in cortical tubers and subependymal giant cell tumors of tuberous sclerosis complex. Epilepsy Res 2008;78:7–21 [DOI] [PubMed] [Google Scholar]
- 25.Chugani HT, Chugani DC. Imaging of serotonin mechanisms in epilepsy. Epilepsy Curr 2005;5:201–206 [DOI] [PMC free article] [PubMed] [Google Scholar]
- 26.Gallagher A, Madan N, Stemmer-Rachamimov A, Thiele EA. Progressive calcified tuber in a young male with tuberous sclerosis complex. Dev Med Child Neurol 2010;52:1062–1065 [DOI] [PMC free article] [PubMed] [Google Scholar]
- 27.Chu-Shore CJ, Frosch MP, Grant PE, Thiele EA. Progressive multifocal cystlike cortical tubers in tuberous sclerosis complex: clinical and neuropathologic findings. Epilepsia 2009;50:2648–2651 [DOI] [PubMed] [Google Scholar]
- 28.Sosunov AA, Wu X, Weiner HL, et al. Tuberous sclerosis: a primary pathology of astrocytes? Epilepsia 2008;49(suppl 2):53–62 [DOI] [PubMed] [Google Scholar]
- 29.Baron Y, Barkovich AJ. MR imaging of tuberous sclerosis in neonates and young infants. AJNR Am J Neuroradiol 1999;20:907–916 [PMC free article] [PubMed] [Google Scholar]


