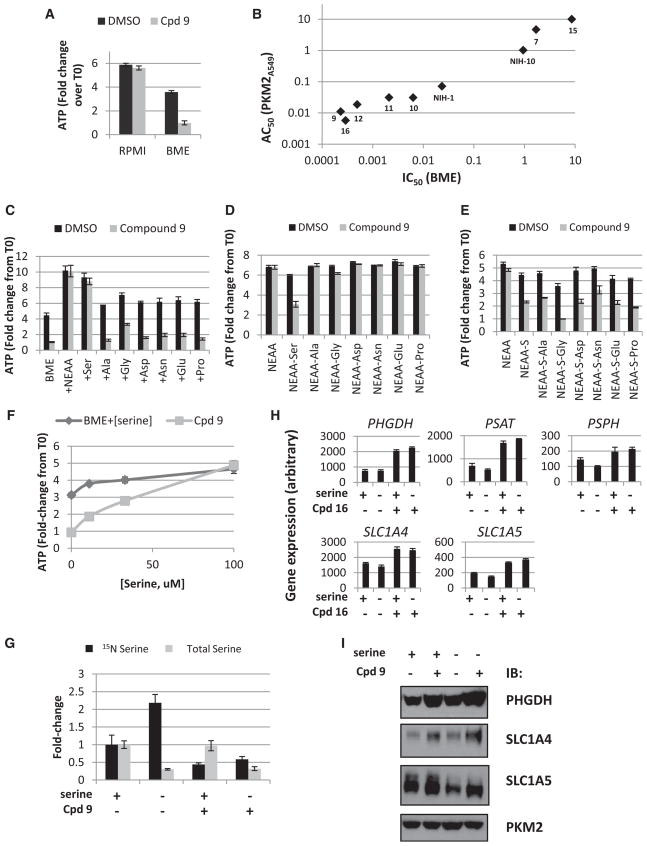
Figure 5. PKM2 Activation Induces Serine Auxotrophy.
(A) A549 cells were seeded overnight 96-well plates and then treated with 9 (1 uM) for 72 hr in RPMI or BME media. Data normalized to ATP levels at time of compound addition (T0).
(B) Compounds were evaluated for their IC50 against A549 cells grown in BME media as in (A) (plotted on the x axis) and for their AC50 in PKM2 activation in A549 cells as in Figure 2D (plotted on the y axis). Linear regression yielded a correlation coefficient (R2) of 0.93.
(C) A549 cells treated with 9 (1 uM) for 72 hr in BME media or BME media with single indicated amino acid added at 100 uM.
(D) A549 cells treated with 9 (1 uM) for 72 hr in BME media or BME+NEAA media lacking each individual amino acid as indicated.
(E) A549 cells treated with 9 (1 uM) for 72 hr in BME+NEAA-serine media or BME+NEAA-serine media lacking a second individual amino acid as indicated. (−S, −serine)
(F) A549 cells treated with 9 (1 uM) for 72 hr in BME media with serine added back at indicated concentrations.
(G) 15N serine (black bars) or total serine (gray bars) levels detected in A549 cells after 24 hr with or without serine withdrawal or PKM2 activation. Cells were labeled with 15N-glutamine as in Figure 3C.
(H) Expression of serine metabolic genes after 24 hr with or without serine withdrawal or PKM2 activation by compound 16.
(I) Western blots from A549 cells treated for 48 hr with DMSO or compound 9 with or without serine withdrawal.
Error bars represent SD. See also Figure S5.

