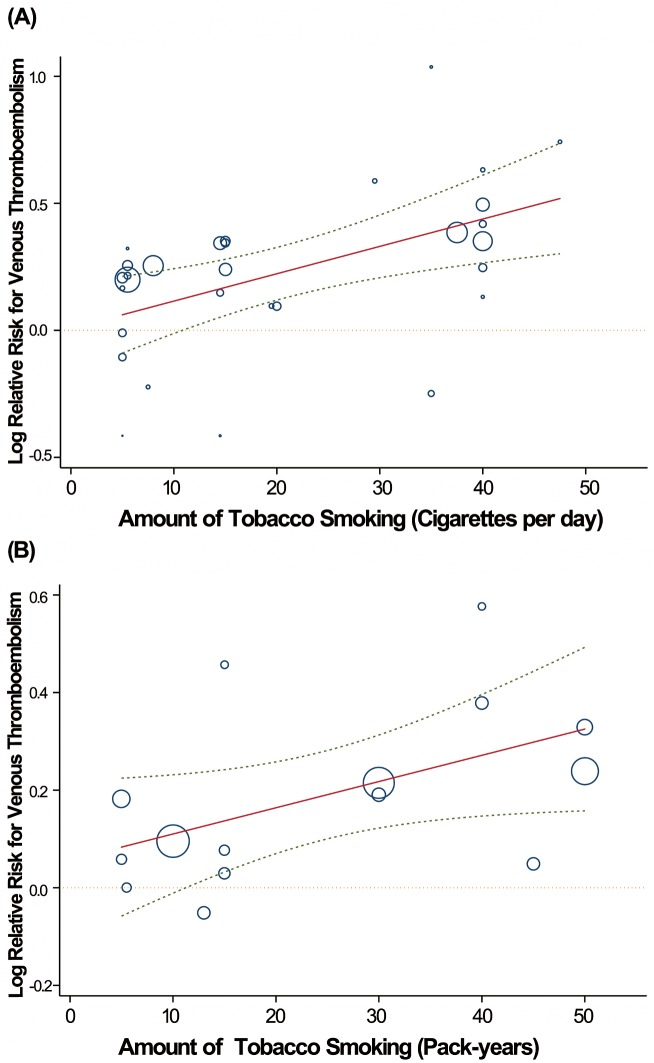
Figure 5. Linear dose-response relationship between relative risk of VTE incidence and tobacco consumption with cigarettes per day (A) and pack-years (B) as the explanatory variables.
The solid line represents point estimates of association between tobacco consumption and VTE risk; dashed lines are 95% CIs. Circles present the dose-specific RR estimates reported in each study. The area of each circle is proportional to the inverse variance of the RR. The dotted line represents the null hypothesis of no association. The vertical axis is on a log scale.

