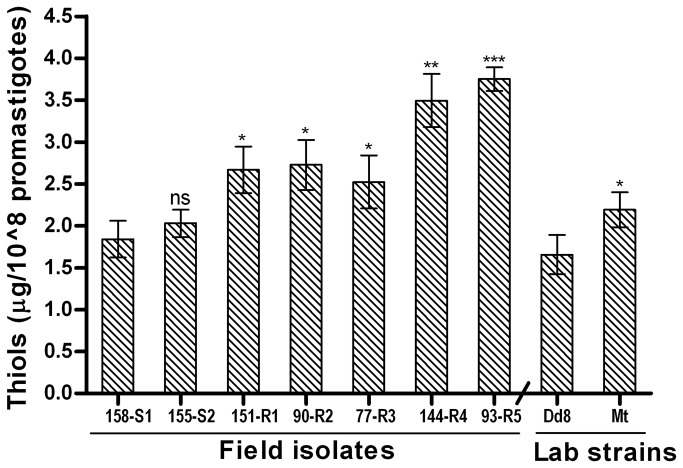
Figure 6. Total intracellular thiol levels in L. donovani isolates.
Values are the mean ± SD of three experiments. * P ≤ 0.05, ** P ≤ 0.005, *** P ≤ 0.0005 indicate statistical significance with respect to sensitive isolate S1 for resistant isolates (R1- R5) and reference sensitive Dd8 for resistant mutant Mt, ns indicates no statistically significant difference.

