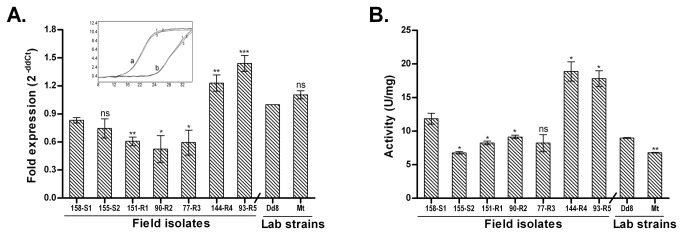
Figure 7. Expression analysis of γ-GCS in clinical isolates of L. donovani.

A. Real time PCR expression ratios of resistant isolates (R1-R5) relative to sensitive isolate S1 and resistant mutant Mt relative to Dd8. B. Specific activity of γ-GCS. Results are mean of three independent experiments. * P ≤ 0.05, ** P ≤ 0.005, *** P ≤ 0.0005; indicate statistical significance with respect to sensitive strains, ns indicates no statistically significant difference. Inset shows the RT-PCR amplification curves; set a: curves for alpha tubulin amplification, set b: represents γ-GCS amplification (curve1: Dd8, 2: 144-R4, 3: Mt). X axis represents PCR cycle and Y-axis represents fluorescence.
