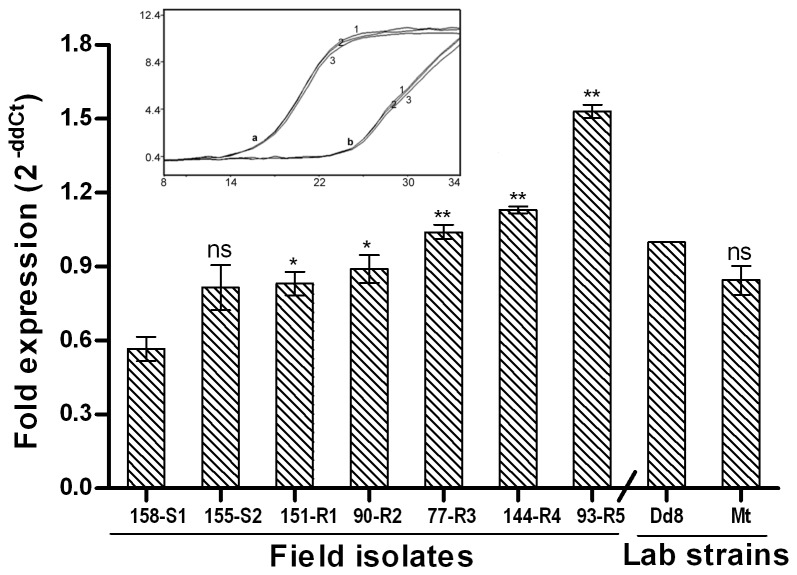
Figure 8. Real time PCR expression analysis of ornithine decarboxylase, one of target genes from the thiol metabolic pathway of L. donovani isolates.
Expression ratios of resistant isolates (R1-R5) relative to sensitive isolate S1 and resistant mutant Mt relative to Dd8 Results are mean of three independent experiments performed from three different RNA preparations. * P ≤ 0.05, ** P ≤ 0.005, *** P ≤ 0.0005; indicate statistical significance with respect to reference sensitive strains; ns indicates no statistically significant difference Inset shows the RT-PCR amplification curves; set a: curves for alpha tubulin amplification, set b: curves for ODC amplifications respectively (curve1: Dd8, 2: 144-R4, 3: Mt). X axis represents PCR cycle and Y-axis represents fluorescence.

