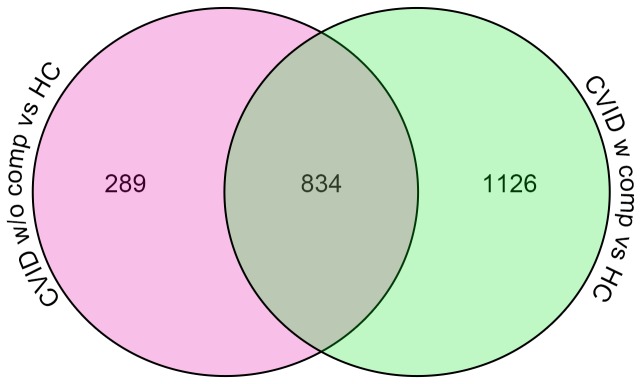
Figure 3. Venn diagram representing the number of common and unique transcripts differentially expressed in patients, compared to healthy controls.

Blood from subjects with inflammatory complications contained more upregulated transcripts as compared to those without complications.
