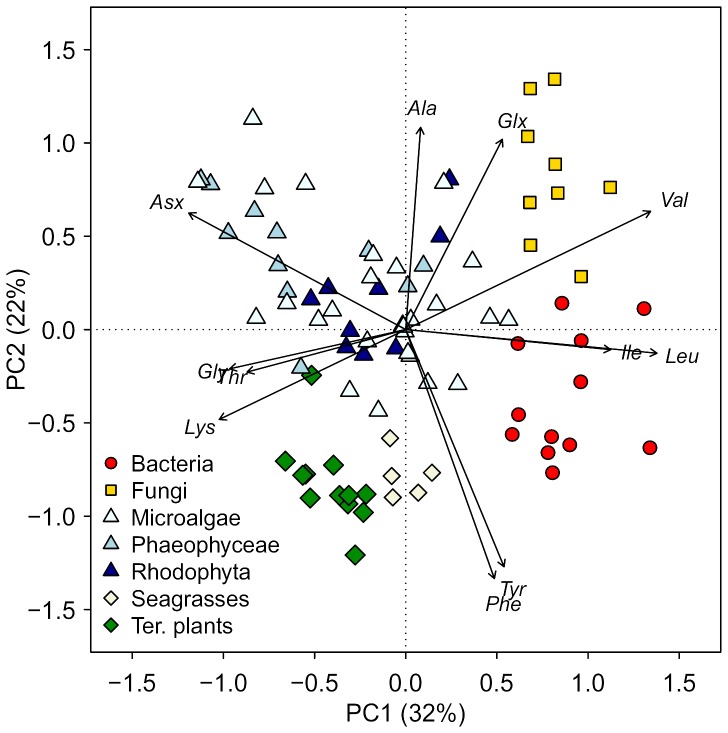
Figure 1. The principal component analysis of δ13CAAn values of different producers show a range of different isotope patterns between bacteria, fungi, vascular plant and algae.
None of the microalgal or macroalgal group clustered separately from one another. Values in parentheses are the percentage variation accounted by each axes. The first axis separates the photoautotrophs from the microbes, and the second axis separates vascular plants from algae, and fungi from bacteria. The fairly similar vector lengths show that almost all amino acids were important for the variations of the two first ordination components. See Table S4 for analytical details.

