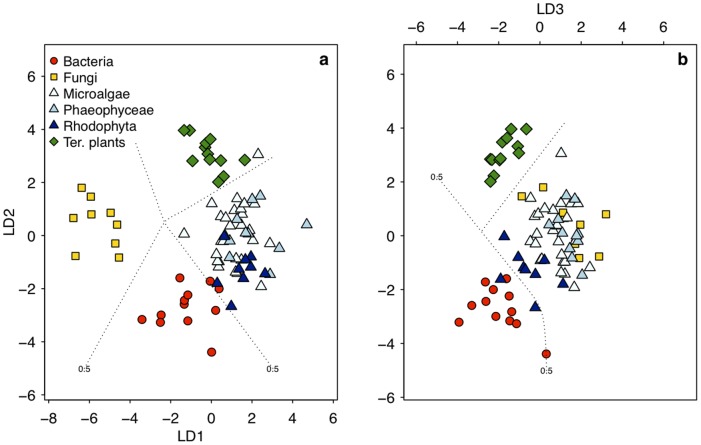
Figure 2. Linear discriminant function analysis based on the δ13CEAAvalues (Ile, Leu, Lys, Phe, Thr, Val) of bacteria, fungi, algae and terrestrial plants.
In the left figure (a) displaying the scores of the first two discriminant axes, fungi and terrestrial plants each cluster separately from algae and bacteria. In the right figure (b) displaying the second and third discriminant axes, bacteria are separated apart from the algae, fungi and terrestrial plants. The dotted lines represent confidence ranges at P = 0.5. See Table S6 for details.

