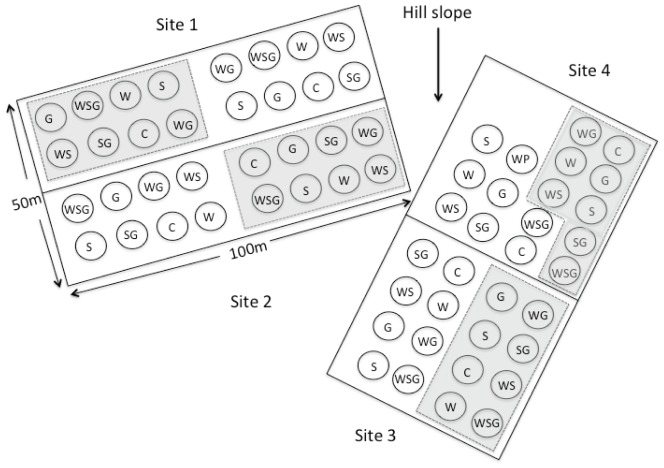
Figure 1. Experimental design and plot layout.
The four treatments were: C = control, S = snow addition, W = warming, and G = yak grazing (not included in this study). Each site had 16 treatments: eight plots including pikas (non-shaded plots) and eight plots excluding pikas (plots shaded in gray). Each 16 treatment plots is replicated four times (4 sites). The plots were blocked horizontally for Sites 1 and 2 but vertically for Sites 3 and 4 to account for the hillside slope. Plots shaded in gray were not included in this study.

