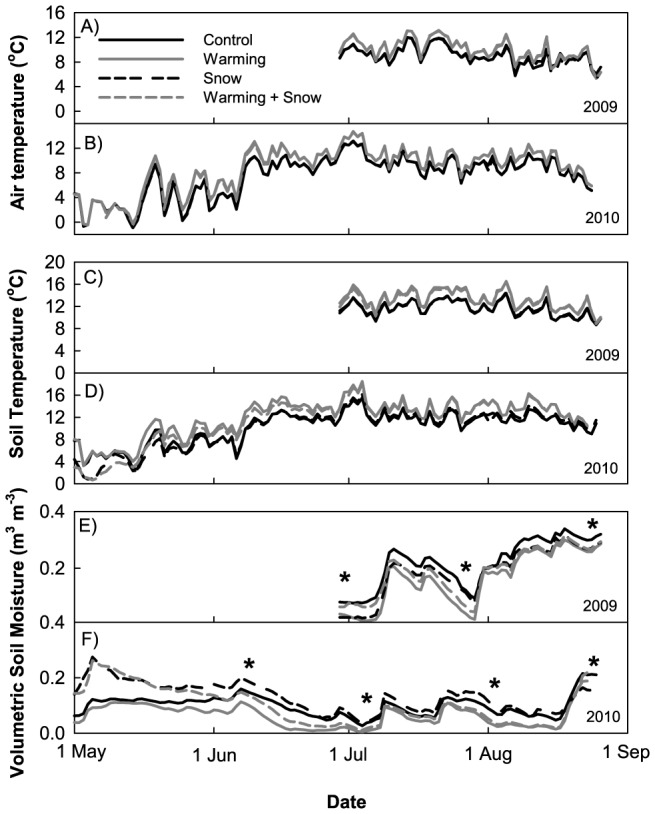
Figure 2. Meteorological measurements.

A, B) Air temperature measured at 10 cm above the soil surface for 2009 and 2010. Note that the snow addition control plot line overlays the snow addition plot line, and the warming plot line overlays the warming×snow addition plot line. C, D) Soil temperature integrated from 0-10 cm below the soil surface for 2009 and 2010. E, F) Soil moisture integrated from 0–10 cm below the soil surface for 2009 and 2010. Asterisks represent the days when soil and plant samples were collected for stable isotope analysis.
