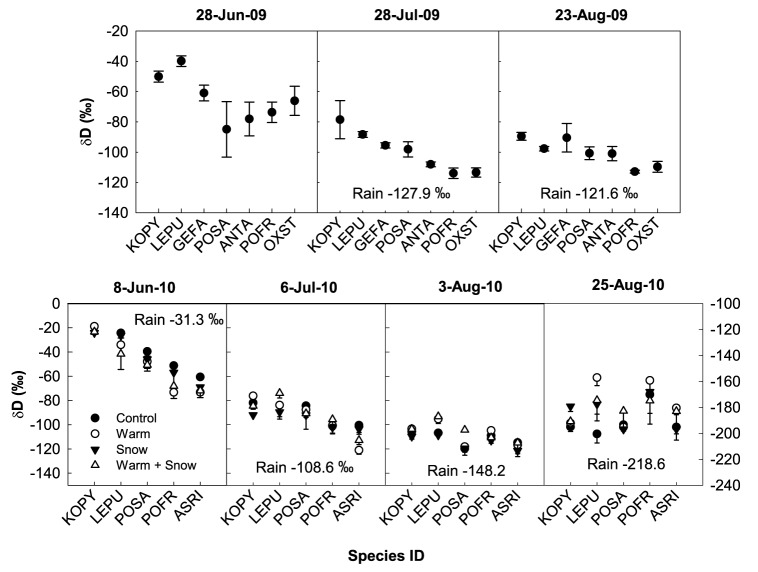
Figure 4. Plant isotope measurements.
δD (‰)±1 SE values of plants water collected during 2009 and 2010 (n = 3). Plants are arranged from shallowest roots (left) to deepest roots (right). KOPY = Kobresia pygmaea, LEPU = Leontopodium pusillum, GEFA = Gentiana farreri, POSA = Potentilla saundersiana, ANTA = Adrosace tapete, POFR = Potentilla fruticosa, OXST = Oxytropis stracheyana, and ASRI = Astragalus rigidulus. For dates 8-Jun-10, 6-Jul-10, and 3-Aug-10, the corresponding y-axis is on the left; for date 25-Aug-10, the corresponding y-axis is on the right. Rain δD values from those collection periods are also reported.

