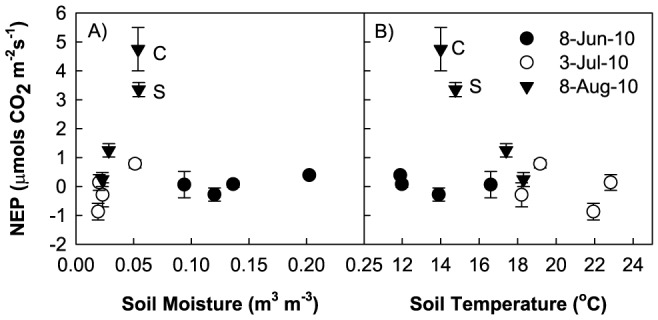
Figure 5. Net Ecosystem Productivity.

Relationship between: (a) NEP and soil moisture and (b) NEP and soil temperature, during the three periods when CO2 flux measurements were made during the 2010 growing season: 8 June (pre-monsoon), 3 July (pre-monsoon), and 8 August (monsoon). C = control, S = snow addition.
