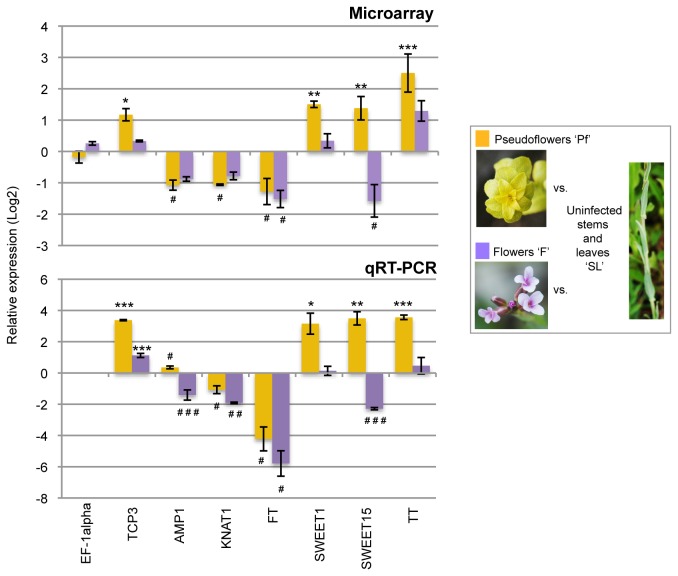
Figure 3. qRT-PCR validation of differentially expressed genes in pseudoflowers.
Quantitative Real Time PCR (qRT-PCR) on a panel of seven genes was used to verify the transcriptional changes observed by microarray analysis. Consistent with the microarray results, expression of TEOSINTE BRANCHED1, CYCLOIDEA, and PCF TRANSCRIPTION FACTOR3 (TCP3, At1g53230), SUGAR TRANSPORTER1 (SWEET1, At1g21460), SUGAR TRANSPORTER15 (SWEET15, At5g13170) and TYROSINE TRANSAMINASE enzyme encoding gene (TT, At4g23590) genes was up-regulated in Pucciniamonoica -induced pseudoflowers (‘Pf’) compared to B . stricta stems and leaves (‘SL’), while ALTERED MERISTEM PROGRAMMING1 (AMP1, At3g54720), KNOTTED-LIKE1 (KNAT1, At4g08150) and FLOWERING LOCUS T (FT, At1g65480) genes was down-regulated (see Table 1). In addition, SWEET15 and FT genes were confirmed to be down-regulated in uninfected B . stricta flowers (‘F’) compared to ‘SL’ as shown by microarray analysis (see Table S2). To indicate the mode of regulation we used two symbols: ‘*’ for significant up-regulation and ‘#’ for significant down-regulation. The number of symbols indicates level of significance: one for P < 0.05, two for P < 0.01 and three for P < 0.001. The error bars represents standard error of the mean.

