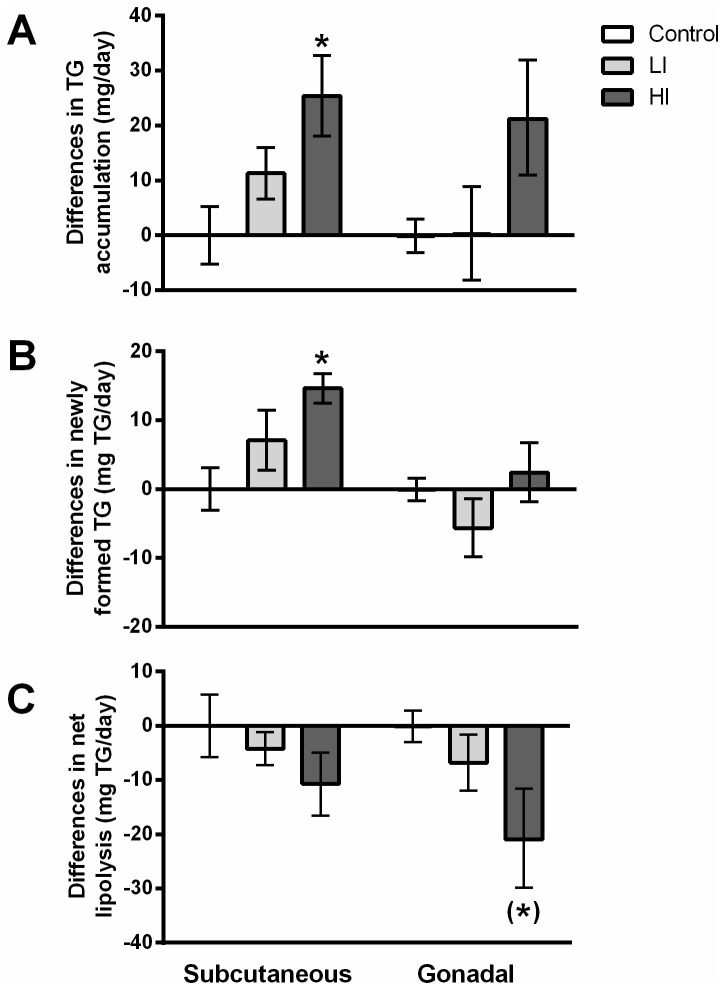
Figure 4. TG dynamics in the adipose depots.
TG-glycerol dynamics within the subcutaneous and gonadal depot, respectively. All values are expressed as mg TG/day relative to the control group by subtracting the mean of the control values from all other numbers. A) Difference in TG accumulated pr day in each adipose depot. B) Difference in amount of TG made pr day. C) Difference in amount of TG released from each depot pr day relative to the control group (net lipolysis). * = p < 0.05 as compared to control; (*)= p < 0.05 (significance obtained with t-test but was lost in the Bonferroni correction). Error bars indicate SE.

