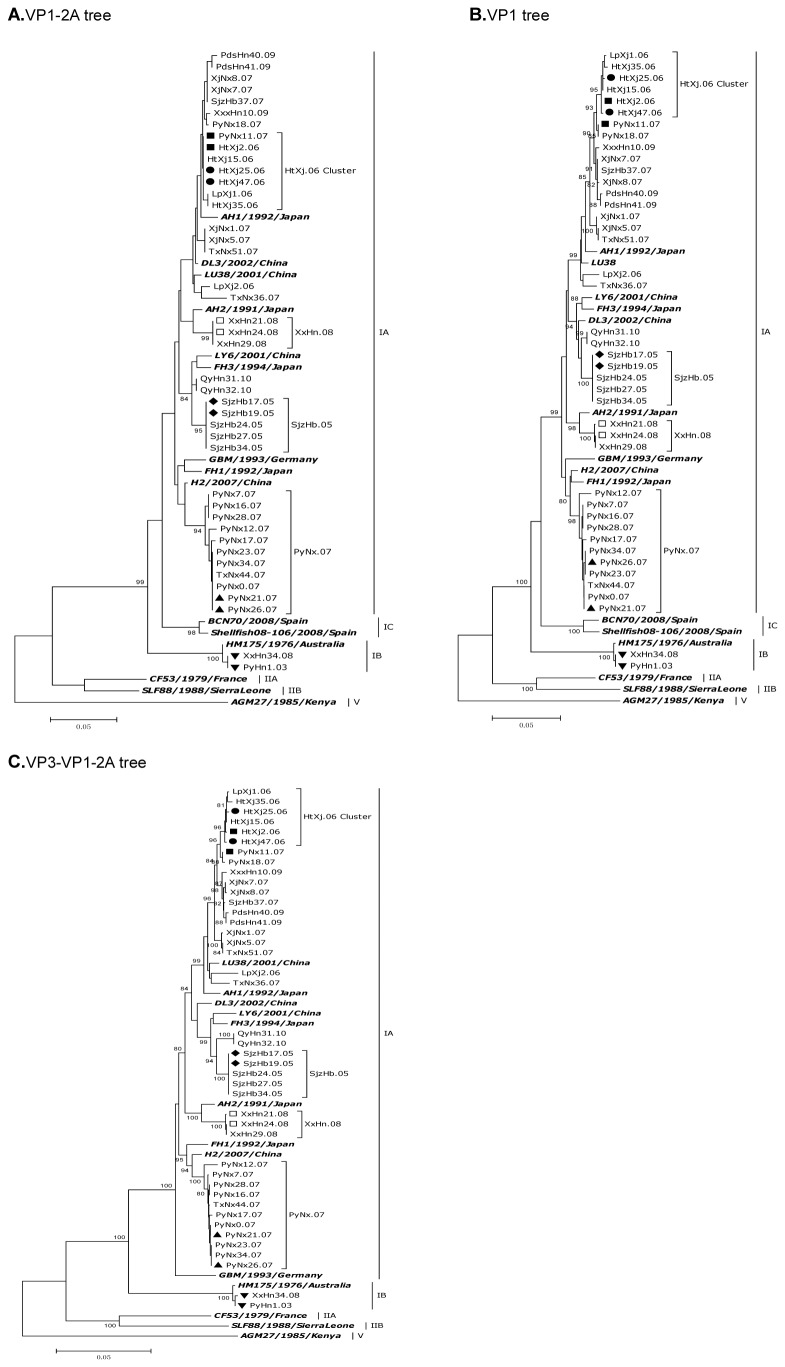
Figure 1. Phylogenetic analysis of HAV sequences isolated in China using Kimura’s two-parameter model.
The VP1/2A junction region (A), complete VP1 (B) and VP3-VP1-2A (C) sequences were used for genotyping (see Table 1 for geographical location and year of isolation. In figure 1 (C) the IC subgenotype was not included for the lack of long enough available sequences). I indicated genotypes or subgenotypes; bold italic showed reference strains reported previously from Genbank. Numbers beside the branches indicate bootstrap percentages obtained after 1000 replications of bootstrap sampling. Bars show distances. ●▲◆■▼□ represent isolates with identical sequences at the VP1-2A junction region respectively, which showed heterogeneity at the complete VP1 or VP3-VP1-2A regions.

