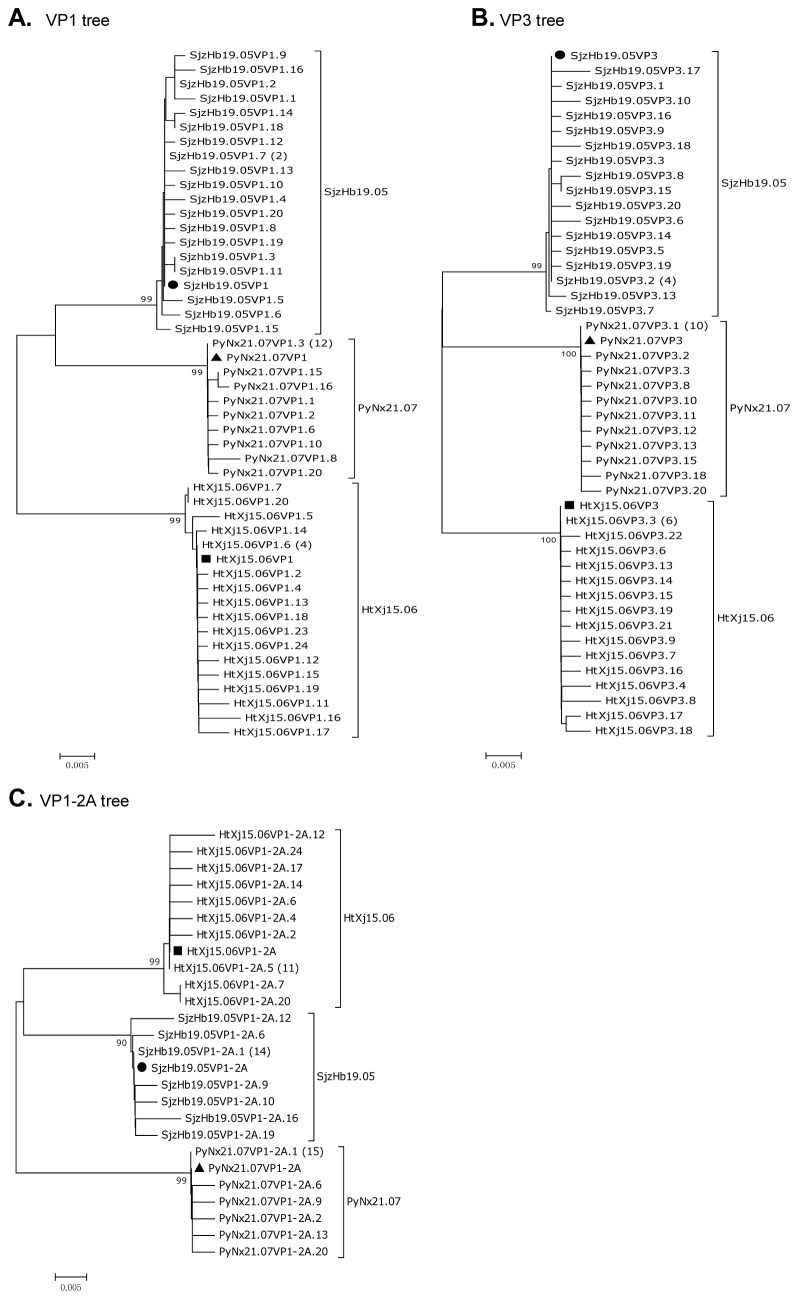
Figure 2. Quasispecies analysis of HAV isolates from three clinical samples.
Phylogenetic tree of the nucleotide mutant spectra of different clones. The complete VP1 (A), complete VP3 (B) and VP1-2A junction region (C) were analyzed. Consensus sequences for SjzHb19.05 (●), HtXj15.06 (■), or PyNx21.07 (▲). Numbers in parentheses indicate clones identical to the consensus sequences. The neighbor-joining method under the Kimura-two parameter distance model was employed. Numbers at the branches show bootstrap percentages obtained after 1000 replications of bootstrap sampling. Bars indicate distances. The heterogeneity of the clones can be seen from the trees.

