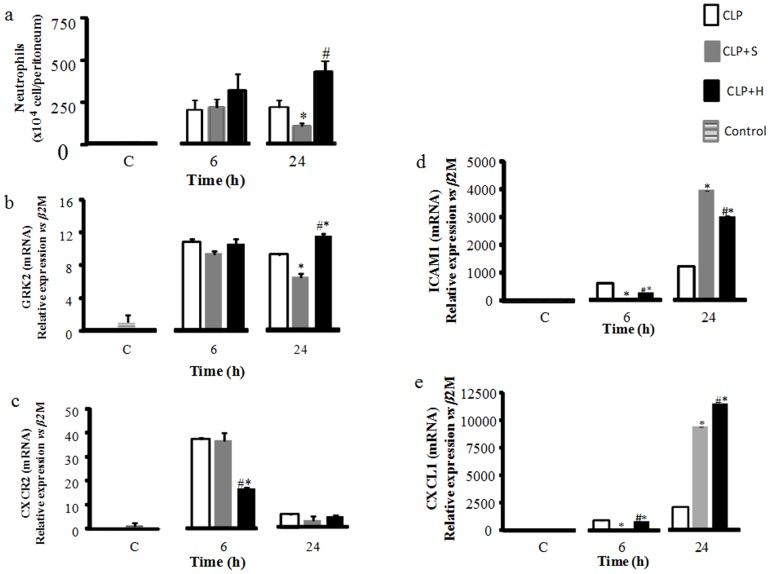
Figure 5. Total leukocyte counts peritoneal lavage fluid (PLF).
CLP was induced in mice (n = 8 in each group), there were three groups: 1- only CLP (white); 2- 30 min later treated with hypertonic saline solution 7.5% (CLP+H) (black) or 3- treated with normal saline solution 0.9% (CLP+S) (gray). Forth group (C) was used to indicate basal levels. A neutrophil count was determined in PLF obtained 6, 12 and 24 hours after CLP. Sepsis induced a significant increase in the neutrophil amount in peritoneal cavity. Normal saline reduced the neutrophil at 24h, while hypertonic increased the neutrophil in this period (a). GRK2 expression increased in CLP and CLP+S group in relation to basal levels, and the expression in CLP+H was increased in relation to CLP and CLP+S (b). CXCR2 expression was increased after CLP procedure and treatment with normal saline, but the expression of CXCR2 was decreased in CLP+H group (c). ICAM-1 expression in group CLP and CLP+H were increased in relation to CLP+S group (d). CXCL-1 expression in the groups that receive treatment reduces in relation to CLP group, interesting that the CLP+H group was higher than CLP+S (e). Data shown represent mean ± SEM. * p<0.05 indicates a significant difference with CLP control; # p<0.05 indicates a significant difference with CLP-S.

