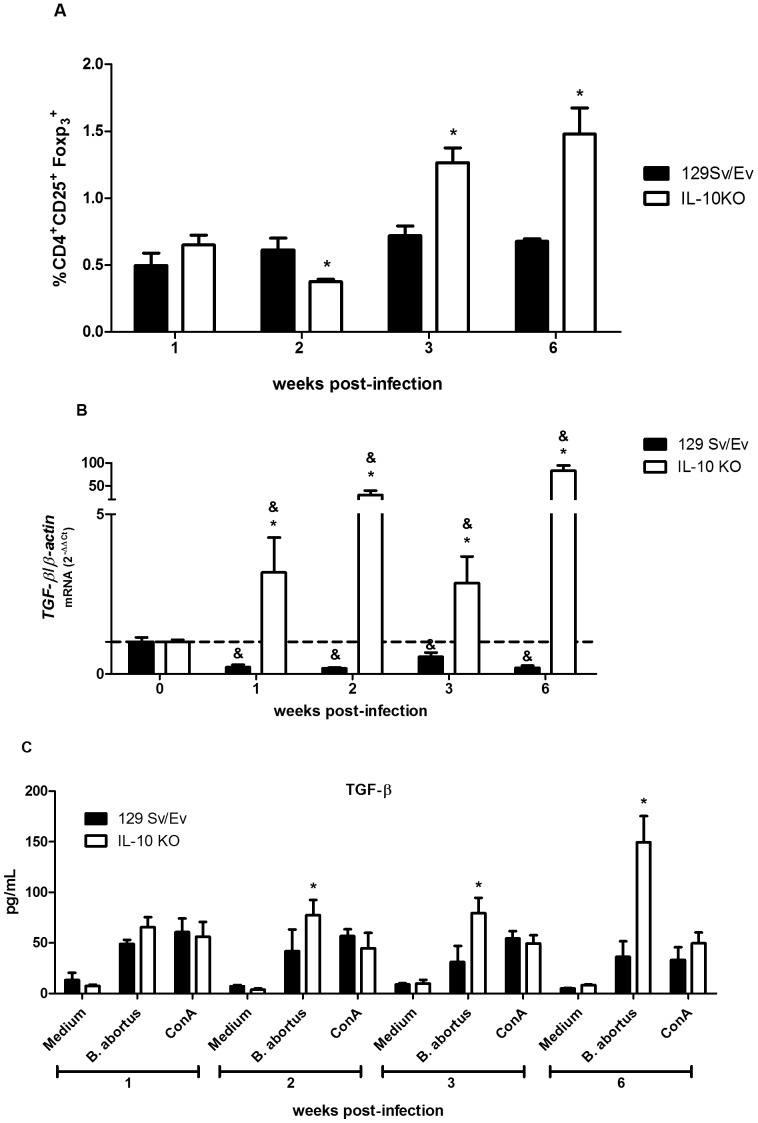
Figure 6. Increased percentage of CD4+CD25+Foxp3+ T cells and TGF-β expression in IL-10 KO mice infected with B. abortus.
(A) Flow cytometry analysis of CD4+CD25+Foxp3+ T cells was carried out in splenocytes from infected (I) or non-infected (NI) mice at 1, 2, 3 or 6 weeks post-infection. Results are expressed as arbitrary units from relative percentage of I/NI CD4+CD25+Foxp3+ T cells encountered in the spleens at indicated time points. The ratio between the percentage of CD4+CD25+Foxp3+ T cells/spleen in I/NI animals was used because of the variation observed on the percentage of these cells in NI mice at different time intervals tested due to the age difference during the duration of the experiment. The experiments were conduct in triplicate and three independent experiments were performed with similar results. Error bars represent the mean ±SD. Statistically significant differences between wild-type and IL-10 KO mice are denoted by an asterisk (p<0.05). (B) Splenocytes from B. abortus infected mice at 1, 2, 3 or 6 weeks postinfection were isolated and total RNA was harvested and mRNA levels of TGF-β1 were determined by real-time RT-PCR and normalized to β-actin. Error bars represent the mean ±SD. Similar results were obtained in three-independent experiments. Statistically significant differences of TGF-β1 expression from IL-10 KO mice compared to wild-type are denoted by an asterisk (p<0.05) and differences of TGF-β expression from infected mice compared to uninfected control (0 week) are denoted by & (p<0.05). (C) splenocyte culture supernatants were harvested for measuring TGF-β1 levels by ELISA. Data are expressed the mean ±SD for five animals per group. Error bars represent the mean ±SD. Statistically significant differences between wild-type and IL-10 KO mice are denoted by an asterisk (p<0.05).

