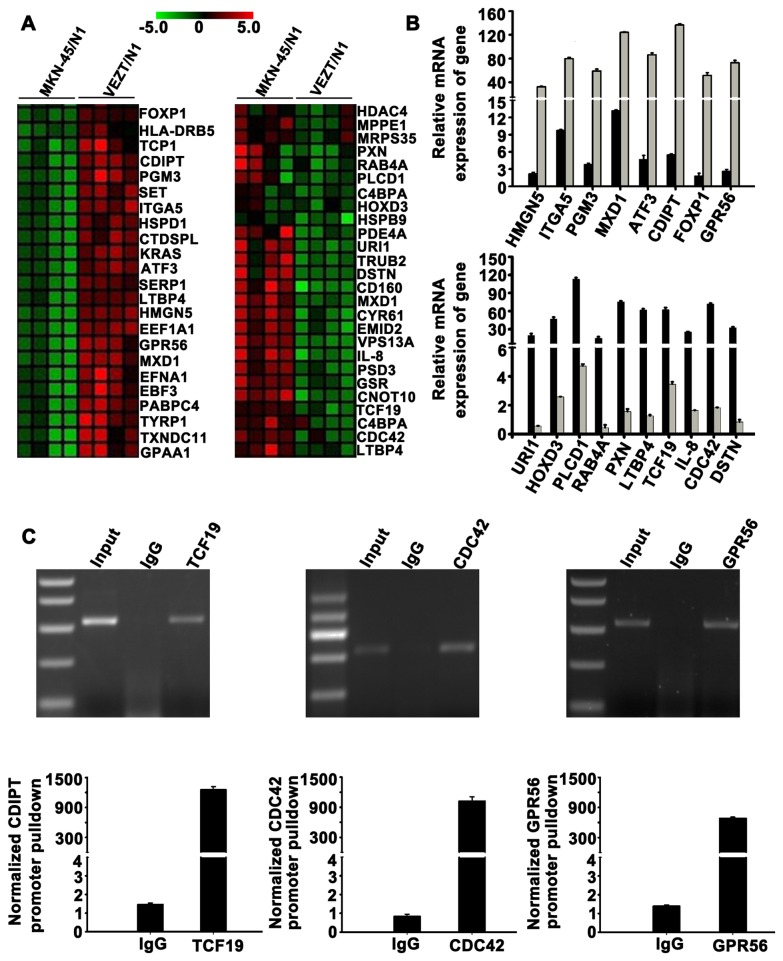
Figure 4. Target gene identification by global microarray analysis.
(A) Clustering map of differentially expressed genes overlapped with cancer-associated genes set in the Molecular Signatures Database. Row represents gene, column represents experimental cells. Upregulated genes are shown in red (left) and downregulated genes in green (right). (B) Upregulation of HMGN5, ITGA5, PGM3, MXD1, ATF3, CDIPT, FOXP1 and GPR56 were confirmed (up). Downregulation of URI1, HOXD3, PLCD1, RAB4A, PXN, LTBP4, TCF19, IL-8, CDC42 and DSTN were confirmed (down). (c) Chromatin immunoprecipitation analysis was done with VEZT antibody using lysates from MKN-45 cells. Promoter pulldowns were assessed through quantitative PCR, which revealed amplified GPR56, TCF19 and CDC42 compared with the negative IgG control.

