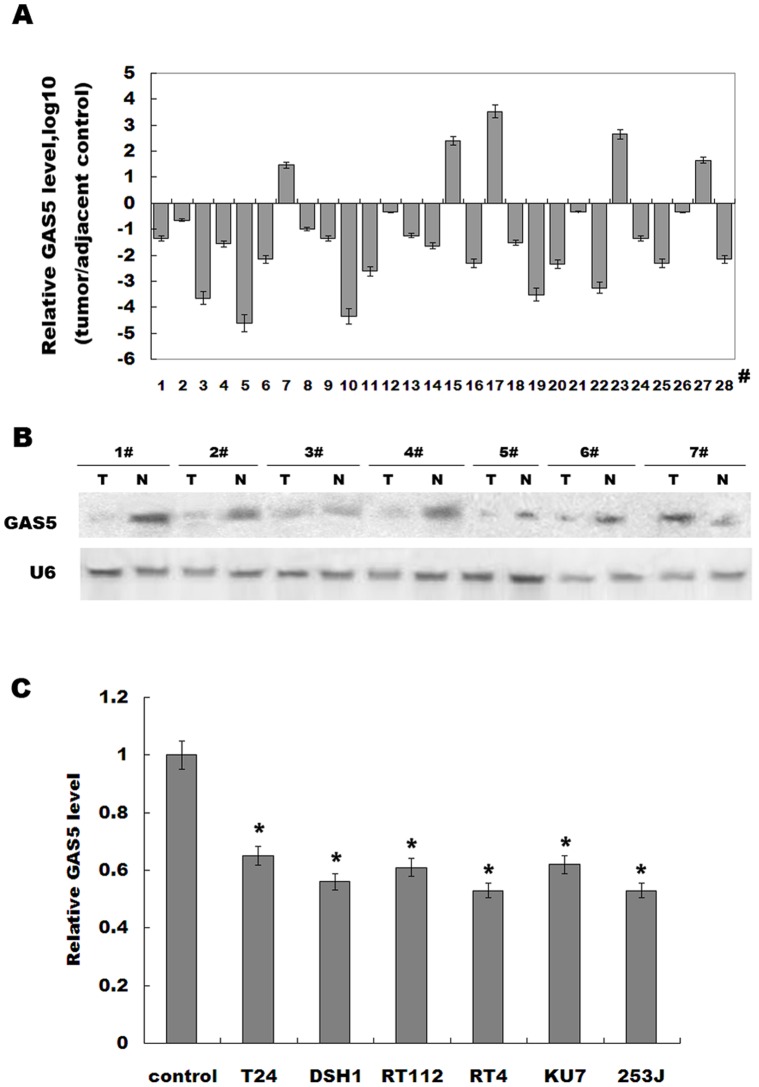
Figure 1. GAS5 levels are decreased in bladder cancer.
(A) Analysis of GAS5 expression level was carried out in bladder cancer tissues or adjacent control (n = 28). Total RNA was subjected to real-time RT-PCR to analyze the CT values of bladder cancer normalized to β-actin in each sample. The normalized values (ΔCT) from all tissues were then compared with a normal tissue, in each group (ΔΔCT). The results were expressed as Log10 (2–ΔΔCt). (B) RNA of 1–7# used in (A) was assayed by northern blot analysis as previously described [32]. (C) GAS5 levels were evaluated by real-time PCR in bladder cancer cell lines. Normal urothelial cells were used as control. *p<0.05.

