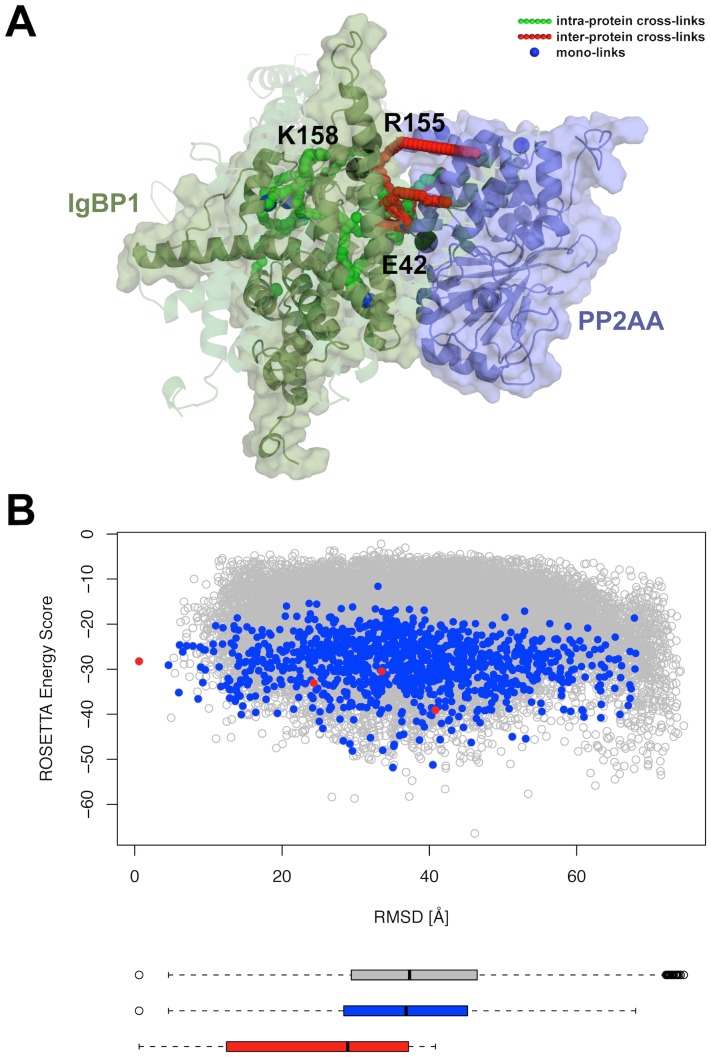
Figure 6. Prediction of the IgBP1-PP2AA protein topology using 7 inter-protein cross-links, 11 intra-protein cross-links and 10 mono-links.
(A) Structural model of the lowest scoring models from the 4 largest clusters, showing the PP2AA protein in purple color and the IgBP1 protein in dark green color. The solid cartoon representation corresponds to the cluster representative of the largest cluster, while the transparent IgBP1 models are cluster representatives of the 2nd, 3rd and 4th largest cluster. Intra-links with their shortest SAS distance path are shown as green colored chains of spheres, inter-links are shown in red and mono-links are highlighted as blue spheres. In addition, black spheres indicate previously mutated amino acids that were shown to be involved in forming the interface of IgBP1 and PP2AA. (B) Overview of the ROSETTA energy scores for all models that satisfied at least 6 inter-protein cross-links by means of the Euclidean distance measure are shown as empty grey circles. The RMSD was calculated to the cluster representative of the largest cluster. Models satisfying at least 6 inter-protein cross-links by means of the SAS distance measure and having a binding interface size ≥900 Å2 are highlighted in blue, while the cluster representatives of the 4 largest clusters are highlighted as red colored circles.

