. 2012 Aug 28;1(1):A0006. doi: 10.5702/massspectrometry.A0006

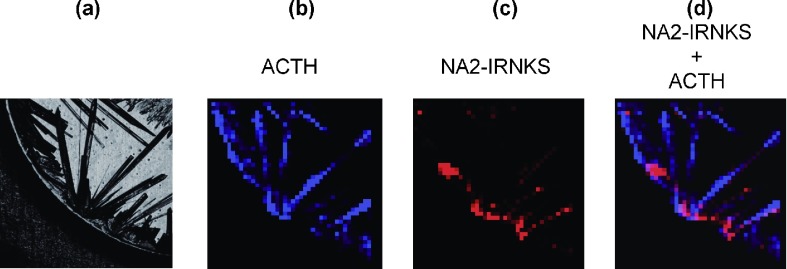
Fig. 2. (a) Enlarged confocal laser microscopy image of the area surrounded with the white line in Fig. 1a. (b) MS image (m/z 2464.9) of a protonated ACTH fragment 18–39 in the same area. The black area indicates no signal and a blue dot with a stronger signal is shown more brightened. (c) MS image (m/z 2239.7) of protonated NA2-IRNKS in the same area. The black area indicates no signal and a red dot with a stronger signal is shown more brightened. (d) The overlay images b and c.

Fig. 2. (a) Enlarged confocal laser microscopy image of the area surrounded with the white line in Fig. 1a. (b) MS image (m/z 2464.9) of a protonated ACTH fragment 18–39 in the same area. The black area indicates no signal and a blue dot with a stronger signal is shown more brightened. (c) MS image (m/z 2239.7) of protonated NA2-IRNKS in the same area. The black area indicates no signal and a red dot with a stronger signal is shown more brightened. (d) The overlay images b and c.