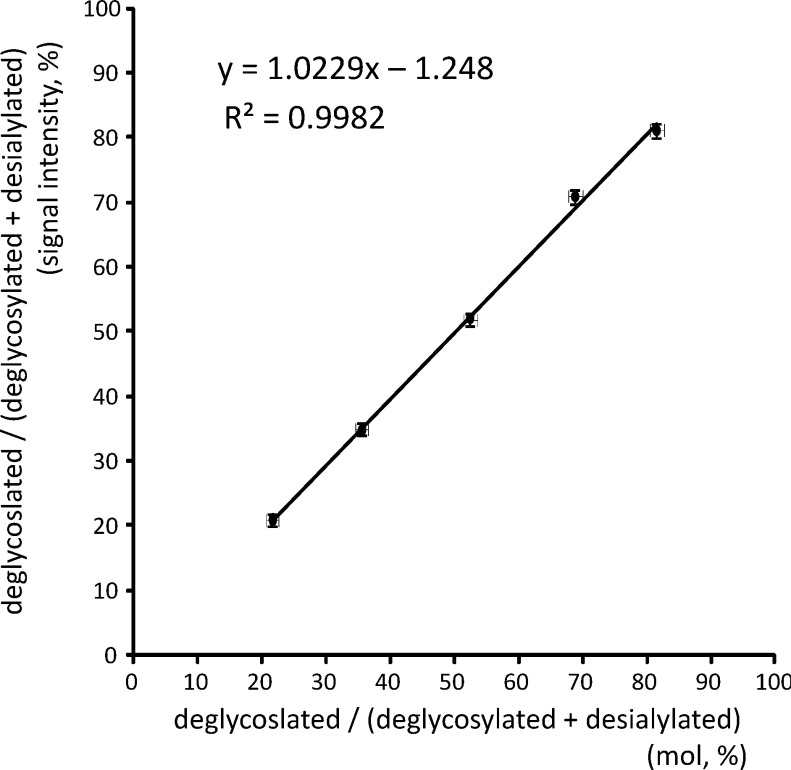
Fig. 2. Correlation of the relative signal intensity in a MALDI mass spectrum and real molar ratio.
The relative concentrations of apoC3 in deglycosylated and desialylated VLDL samples were measured by HPLC, and these samples were mixed at varying molar ratios and analyzed by MALDI linear TOF MS. The relative signal intensities were plotted against the molar ratios (mean±S.D., n=5).

