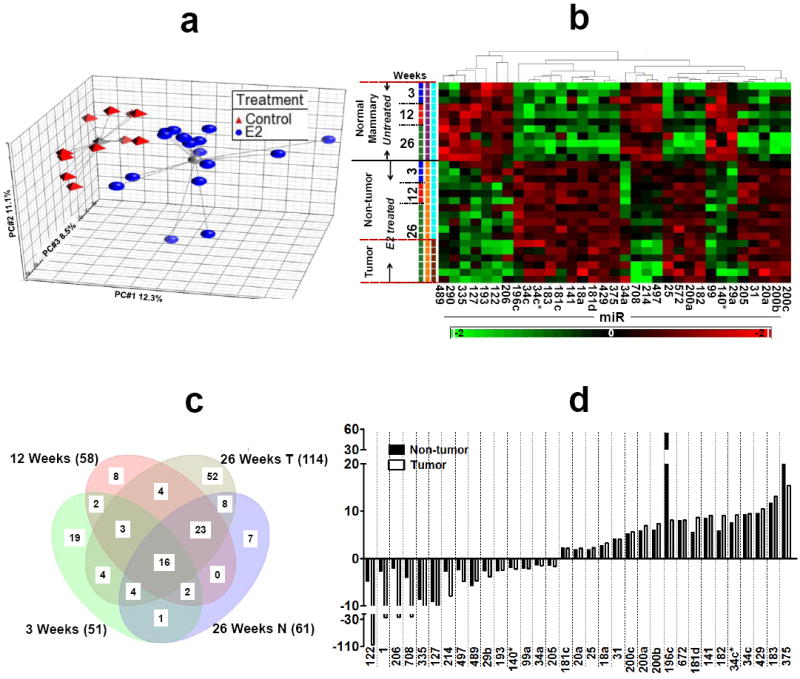
Figure 1. miRNA expression profile during E2-mediated mammary tumorigenesis.

a) Principal component analysis of ANOVA-selected miRNAs. Red triangles represent untreated control animals and blue circles represent E2-treated animals. The grey lines connect to a centroid (grey triangle or grey ball). The PC#1, PC#2 and PC#3 represents the first three largest variable principle components accounting for the majority of the variance within the dataset; b) Hierarchical clustering of 28 samples and 33 differentially expressed miRNAs. Rows represent sample, and columns represent miRNA. The bar code at the bottom represents the color scales of the log2 values; c) Venn diagram of miRNAs regulated at different time points of E2 treatment. All miRNAs are significant at p<0.05. MiRNAs at the intersections represents the overlapping/common miRNAs modulated by E2 at different treatment while miRNAs that are located outside the overlaps can be considered E2 independent miRNAs; d) the bar diagram represents fold change of the top 33 miRNAs in the non-tumor (distal normal mammary) and tumor tissues of ACI rat after 26 weeks of E2 treatment.
