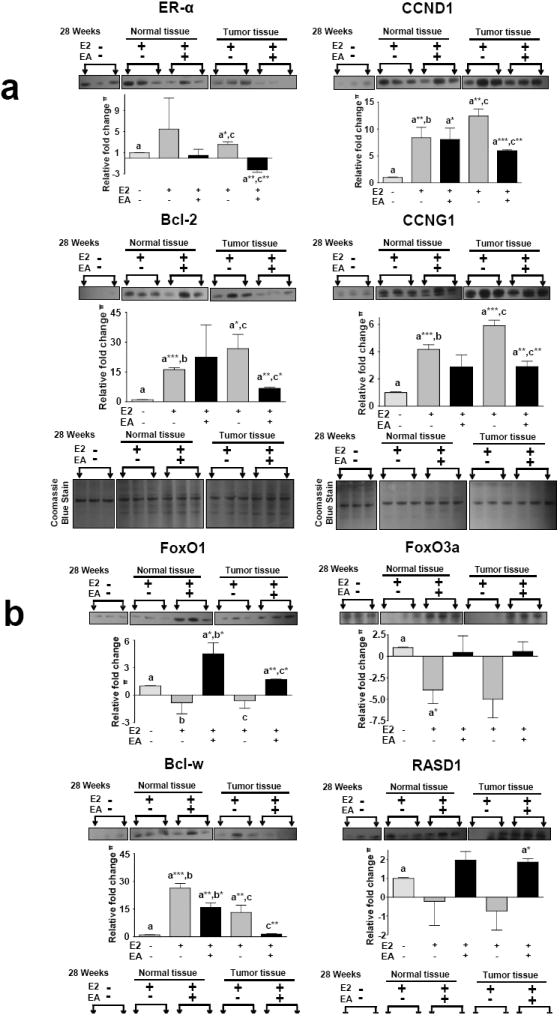
Figure 5. Effect of EA on protein expression levels.

Western blot analysis was performed for the represented proteins. The top panel proteins (Fig 5a and 5b) were stripped and re-probed with different antibody (bottom panel). Equal Loading was confirmed by Coomassie blue staining. Densitometry was performed using imageJ software and the bar graph is given below each blot. Representative blots are shown.
