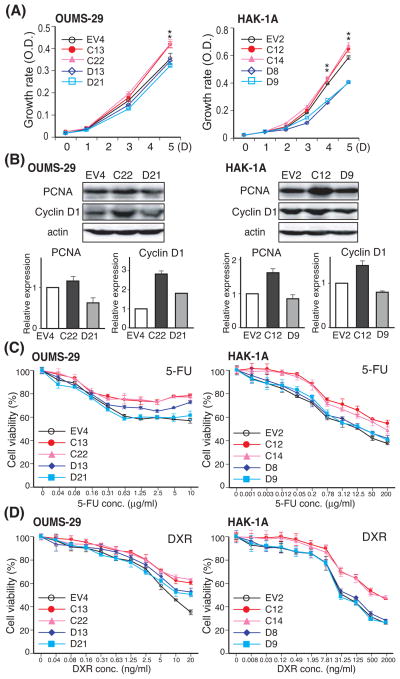
Fig. 3. Effect of TCF-4C and D isoform expression on cell proliferation, cell cycle progression, and resistance to chemotherapeutic reagents including 5-FU and DXR.
(A) Cell proliferation rate of the stable clones derived from OUMS-29 (left panel) and HAK-1A (right panel). The growth rate was measured by MTS assay over 5 days and are expressed as mean ± SD. *, P < 0.05 compared to EV and TCF-4D clones. (B) Protein expression of PCNA and Cyclin D1 in stable clones derived from OUMS-29 (left panel) and HAK-1A (right panel) were confirmed by Western blot analysis using antibodies against PCNA, Cyclin D1, and actin as a loading control. Expression level was determined by densitometry and normalized to actin. Relative expression depicts as the fold changes compared to EV control (lower panel). The results are shown as mean ± SD. (C, D) Stable clones derived from OUMS-29 (left panel) and HAK-1A (right panel) were treated with 5-FU (C) or DXR (D) for 72 hrs. The cell viability of stable clones was determined by MTT assay. Each value is expressed mean ± SD.

