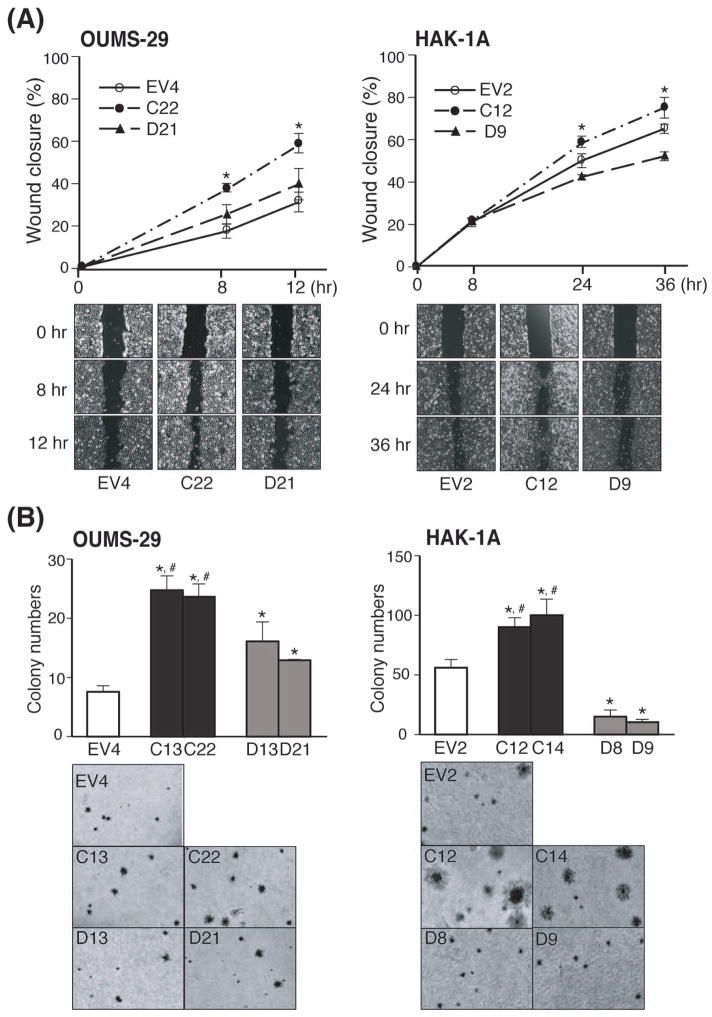
Fig. 4. Effect of TCF-4C and D expression on cell migration and colony formation in soft-agar.
(A) Cell migratory capacity of the stable clones (OUMS-29: left panel, HAK-1A: right panel) assessed by wound healing assay. Upper panel: The graph represents percentage of wound closure and representative pictures at the indicated time are shown. The percentage of wound closure is expressed as mean ± SD. *, P < 0.05 compared to EV and TCF-4D clones. Lower panel: Representative wound-healing closure photographs were taken at the indicated time (40×). (B) Anchorage-independent cell growth of the stable clones (OUMS-29: left panel, HAK-1A: right panel) assessed by soft-agar colony formation assay. The bar graph (upper panel) indicates colony numbers and representative photographs (lower panel) are shown (40×). The colony numbers are expressed as mean ± SD. *, P < 0.05 and #, P < 0.05 compared to EV and TCF-4D clones, respectively.

