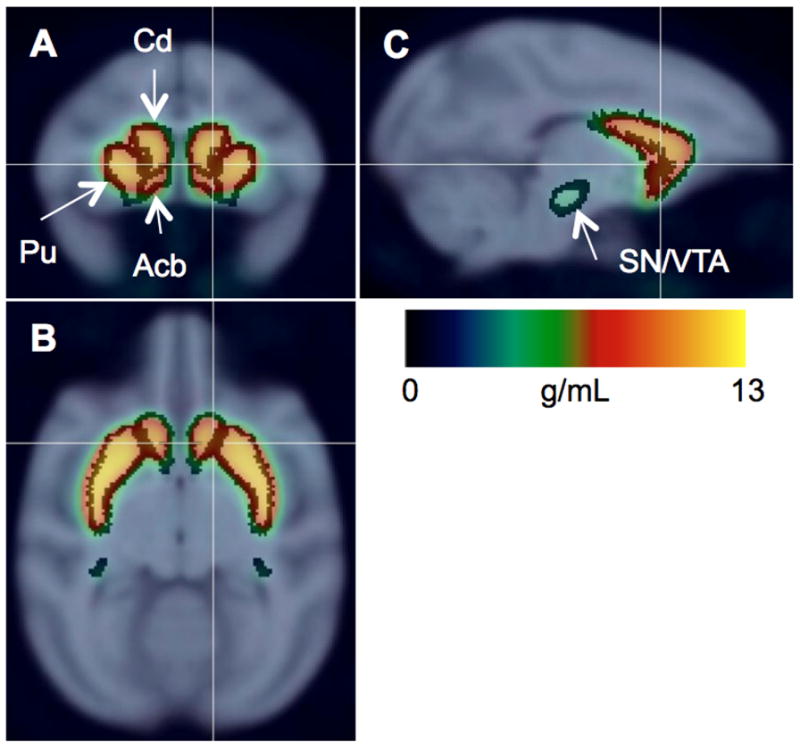
Figure 1. [18F]FECNT image.

Radioactivity images of control subjects (n = 12, 0–150 min) scaled to injected dose/body weight, averaged, and overlaid on MRI template with regions of interest shown for nucleus accumbens (Acb), caudate (Cd), putamen (Pu), and substantia nigra/ventral tegmental area (SN/VTA). Coronal (a), axial (b), and sagittal (c) slices shown at right striatum.
