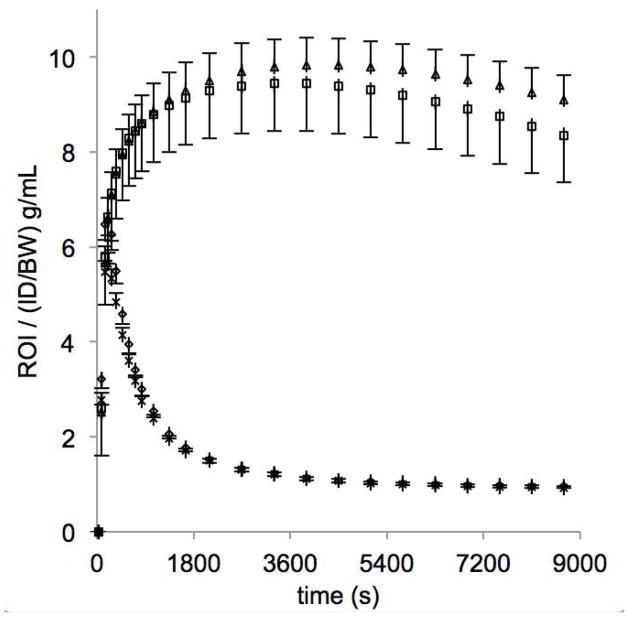
Figure 2. Time-Activity curves.
Mean radioactivity normalized to injected dose per body weight for monkeys not exposed to prenatal stress (n = 22) and monkeys exposed to prenatal stress (n = 16). Curves are shown for the cerebellar reference region (no stress: ◇, stress: X) and striatum (no stress: □, stress: △). Error bars indicate SEM.

