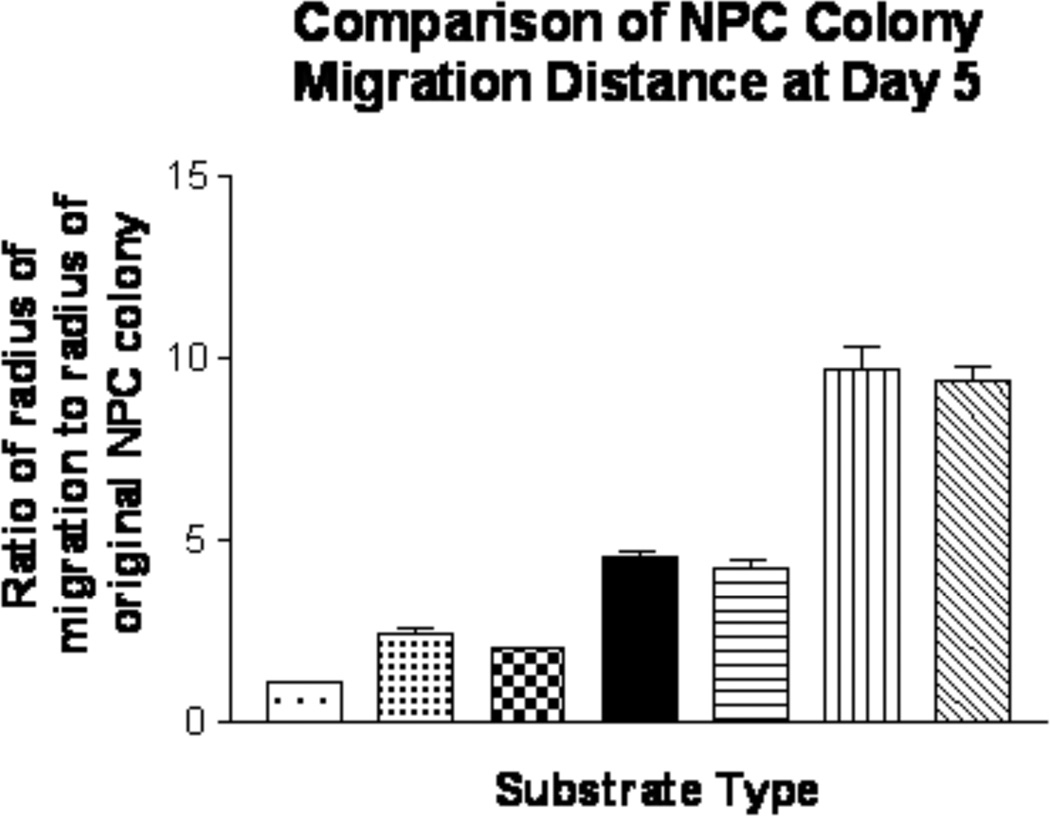
Figure 7.
Extent of NPC migration on different alginate constructs. Cell migration distance was calculated as a ratio of the original NPC colony radius to the final migration. All quantification was done after NPCs had attached and differentiated for 5 days in culture (n=10).  Plain alginate disc (no coat),
  Laminin coated alginate disc,
  Laminin coated culture dish (no alginate),
  Laminin coated disc + encap. Fb/BDNF,
  Laminin +PLO + Fb/BDNF disc,
  Laminin coated disc + encap. Fb/NT3,
  Laminin+PLO alginate disc + Fb/NT3

