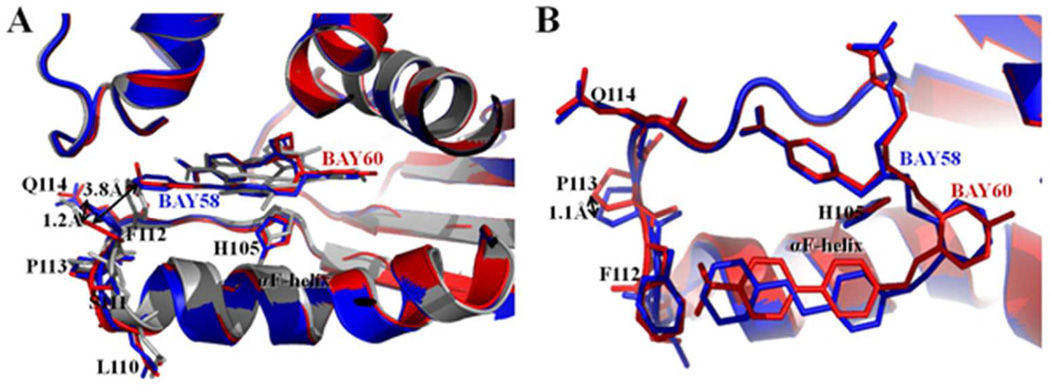
Figure 5.
Comparison between BAY 58-2667 and BAY 60-2770 bound Ns H-NOX structures. BAY 58-2667 bound Ns H-NOX structure in blue color and BAY 60-2770 bound C139A Ns H-NOX structure in red color. (A) Side view of cartoon superposition of BAY 58 bound and BAY 60 bound H-NOX structures showing no structural change in αF-helix while its C-terminus loop region 110-114 is altered; side chains of loop region residues are shown in sticks and BAY 58 and BAY 60 drug molecules are shown in blue and red stick models, respectively. As a reference, the superimposed heme-bound protein structure of H-NOX is shown in grey. (B) Top view of figure 5 (A), distances between side chain positions are shown with double-head arrows. BAY 58-2667 and BAY 60-2770, H105 of αF-helix and loop residues - L110, S111, F112, P113, Q114 are shown in sticks.

