
Table 3.
Examples of structural modifications that are expected to reduce ER binding affinity (based on the analysis of significant descriptors in QSAR models).
| ERβ Binder | Structural features | Modified Chemicals | Predicted ERβ binding affinity by MTL models | Experimental ERβ binding affinity | |
|---|---|---|---|---|---|
| Descriptor | Suggested modification | ||||
 logRBAERβ=0.64 ARR=0.79 B01[NO]=0 B09[OC]=1 nArOH=0.2 |
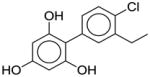
ARR (negatively correlated with binding affinity) | Increase aromatic ratio by removing alkyl chain |
 ARR=0.89; % Dscr profile changed=92 |
−0.44 | −0.68 |
| B01[NO] (negatively correlated with binding affinity) | Add N-O motif |
 B01[NO]=1; %Dscr profile changed=85 |
−0.42 | N/A | |
| B09[OC] (positively correlated with binding affinity) | Remove O-C at topological distance 9 |
 B09[OC]=0; %Dscr profile changed=60 |
−0.15 | N/A | |
| Modifications Not Suggested |
 nArOH=0.6; %Dscr profile changed=16 |
1.17 | N/A | ||
| nArOH (positively correlated with binding affinity) | Add OH groups attached to aromatic ring | ||||
% Dscr profile changed indicates the percentage of descriptors changed in the favorable direction due to the structural modifications. In order to decrease a compound binding affinity, the values should be decreased (increased) for descriptors that positively (negatively) correlate with ER binding affinity. The values of “%Dscr profile changed” were calculated as (number of positively correlated descriptors whose values decreased + number of negatively correlated descriptors whose values increased)/(total number of descriptors).
N/A, not available.