11.
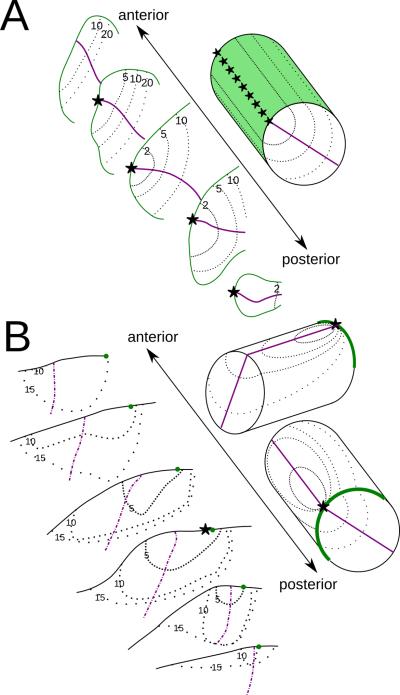
Two ways that a 2-D contralateral visual field could be represented in a 3-D brain structure. A: retinotopy of the inferior map of the macaque pulvinar adapted from Figure 11 of Bender, 1981, and an simplified model of that map in the upper-right corner. B: retinotopy of the inferior map in bush baby pulvinar, and its simplified model in two different views. In the simplified models, stars indicate central vision representations. Purple lines show the intersection of the horizontal meridian (HM) representations with the structure surface for the simplified model, and HM for the coronal sections. The vertical meridian (VM) is shown either as a green surface or a green line. Note that most of the visible intersection between HM and the surface in the left panel is also the intersection between the HM and VM representations, and thus the central vision representation. Thin dotted lines are iso-eccentricity contours, with lower eccentricity represented by denser dotted lines. The VM representation line in B is only on the structure surface, in contrast to all other lines representing the intersection between a plane in the structure and the structure surface. Numerals indicate eccentricity in degrees.

