3.
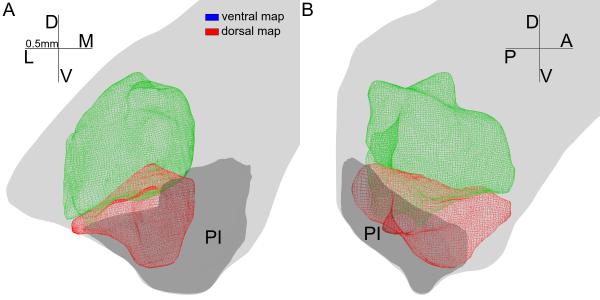
3-D views of the dorsal (green) and ventral (red) map. The model of the dorsal map contains all recorded units showing receptive field before the progression reversal. Similarly, the model of the ventral map contains all recorded units after the receptive progression reversal. Both models were smoothed so a few (<5) for each structure) recording sites are left out. A coronal view is shown in panel A and a parasagittal view is shown in panel B. Light gray shows the outline of the pulvinar. Dark gray shows the outline of the inferior pulvinar. D, dorsal; L, lateral; V, ventral; M, medial; A, anterior; P, posterior. Each arm of the compass is 0.5mm in the model.

