
Fig.2. PET imaging allows assessment of the fate of engineered MSC in vivo.
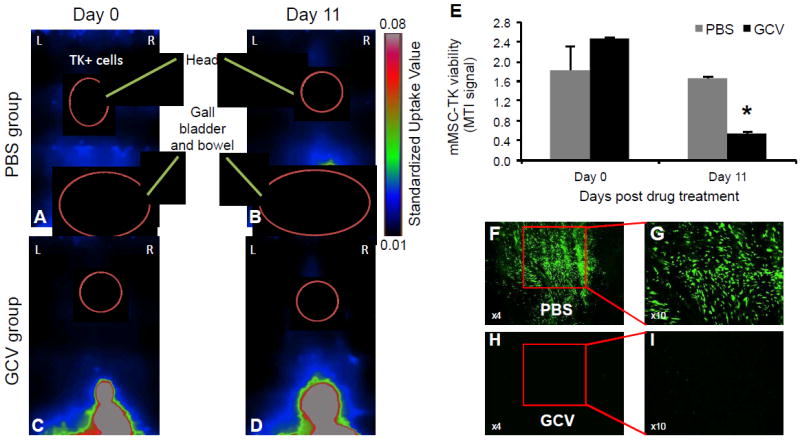
(A-D) Mice bearing mMSC-TK were imaged by PET using 18F-FHBG pre (A,B)- and post (C,D)- GCV treatment. Representative images of a mouse from each group are shown. (E) Plot shows MTI signal values pre and post GCV treatment from the control PBS and GCV group. MTI represents the amount of 18F-FHBG uptake in the entire tumor. Bars, +SD. (F-I) Low and high resolution photomicrographs (original magnification, x4 and x10 respectively) from brain sections show the long-term fate of mMSC-TK-GFP in control PBS and GCV injected mice at day 50 post GCV treatment. In all panels, *, p < 0.05 versus controls. Abbreviations: mMSC, primary mouse mesenchymal stem cells; GCV, ganciclovir; TK, Herpes Simplex Virus Thymidine Kinase; MTI, molecular tumor index; PBS, phosphate buffered saline.