
Fig. 5. MSC-TR-TK has antitumor effect and its fate can be imaged in vivo.
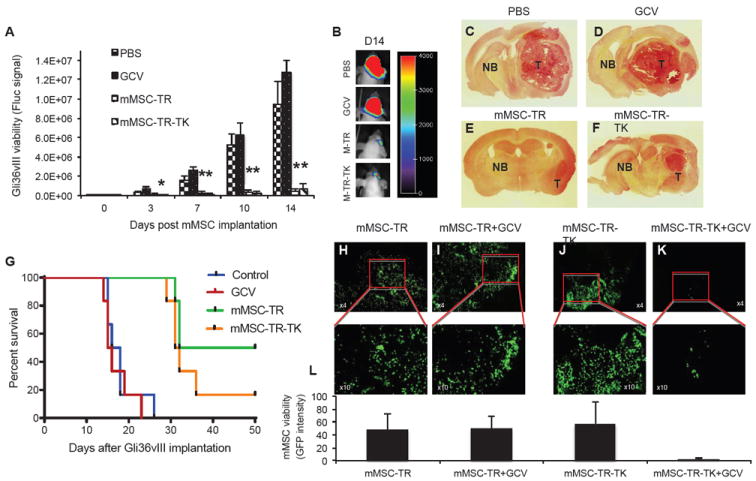
Mice bearing Gli36vIII-FmC were treated intratumorally with mMSC-TR-TK, mMSC-TR, control PBS, or GCV intraperitoneally and imaged for Fluc activity. (A) Plot shows the relative mean bioluminescent signal intensity after quantification of in vivo images. Bars, +SE. (B) One image from a representative mouse of each group at day 14 post mMSC implantation is shown. (C-F) H&E photomicrographs of brain sections of a representative mouse from PBS (C), GCV (D), mMSC-TR (E) or mMSC-TR-TK (F) groups at day 14 post mMSC implantation (original magnification, x2) is shown. (G) Kaplan-Meier survival curves of Gli36vIII-FmC bearing mice treated with PBS, GCV, mMSC-TR or mMSC-TR-TK. (H-K) Gli36vIII-FmC bearing mice were intratumorally implanted with mMSC-TR (H and I) or mMSC-TR-TK (J and K) and fourteen days later treated with GCV or PBS. Photomicrographs (original magnification, x4 upper panel and x10 lower panel) from brain sections of PBS (H and J) or GCV (I and K) groups post 18 days after GCV treatment are shown. Quantification of mMSC viability measured by GFP intensity from the brain section above (L). In all panels, *, p < 0.05 versus controls. Abbreviations: mMSC, primary mouse mesenchymal stem cells; GCV, ganciclovir; T, Tumor tissue; NB, Normal brain; TK, Herpes Simplex Virus Thymidine Kinase; TR, tumor necrosis factor apoptosis-inducing ligand; PBS, phosphate buffered saline.