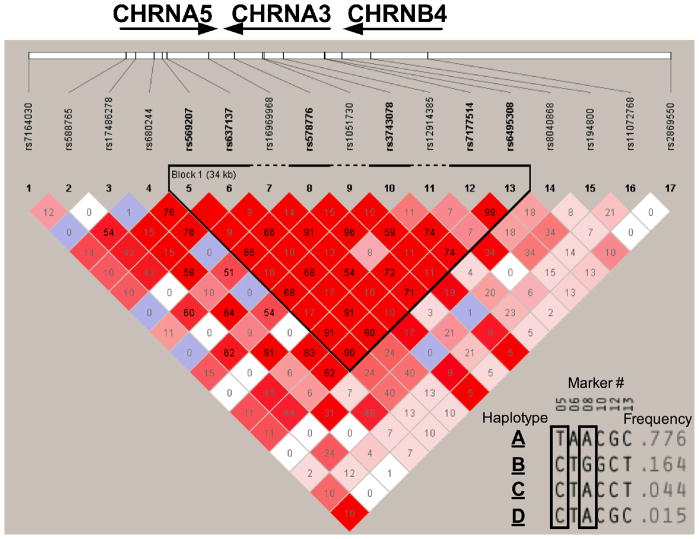
Figure 1.
Observed CHRNA5-A3-B4 haplotype structure in Alaska-Native people.
The number in the squares indicate the r2 score.
Insert: A haplotype analysis revealed a 30kb region of high linkage disequilibrium between CHRNA5 and CHRNA3.Within this haplotype block, four haplotypes with a prevalence of more than 1% were identified. These four haplotype could be discerned by a few tag SNPs. For example, haplotype A was tagged by rs569207 in our sample (marker #5), while haplotype B was tagged by rs578776 in our sample (marker #8)

