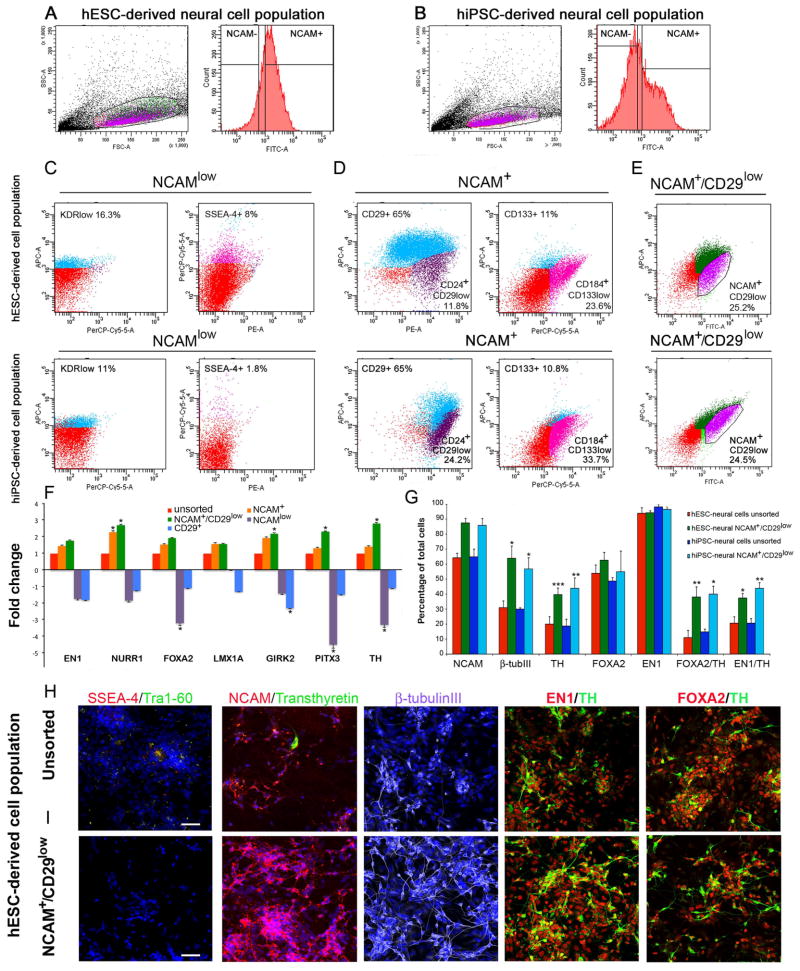
Figure 3. Enrichment of hESC- and hiPSC-derived DA neurons with cell sorting.
Population determination and gating strategy for A. hESC-derived neural cell population and B. hiPSC-derived neural cell population with NCAM-staining. Characterization of subpopulations derived from hESC- and hiPSC-neural cell populations: Panel C. NCAMlow subpopulation was positive for KDRlow (11–16.3%) and SSEA-4 (1.8–8%). Panel D. NCAM+ subpopulation was positive for CD29 (65%), CD133 (10.8–11%), CD184+/CD133low (23.6–33.7%). Panel E. Out of the total cell population, the NCAM+/CD29low subpopulation was 24.5–25.2%. F. Q-RT-PCR analysis shows that the NCAM+/CD29low subpopulation has an upregulated DA neuron specific gene expression profile compared to the unsorted cell population and the NCAM+, NCAM−, and CD29+ subpopulations. G. Immunocytochemical cell counts reveal that hESC- and hiPSC-derived NCAM+/CD29low sorted cell populations have enriched expression of NCAM, β-tubulinIII, TH, FOXA2/TH, EN1/TH cells compared to unsorted cell populations. Panel H. Immunocytochemical characterization of the unsorted hESC-derived DA neuron population. Panel I. Immunocytochemical analysis of the NCAM+/CD29low sorted hESC-derived DA neuron population. Scale bar 50 μm.

