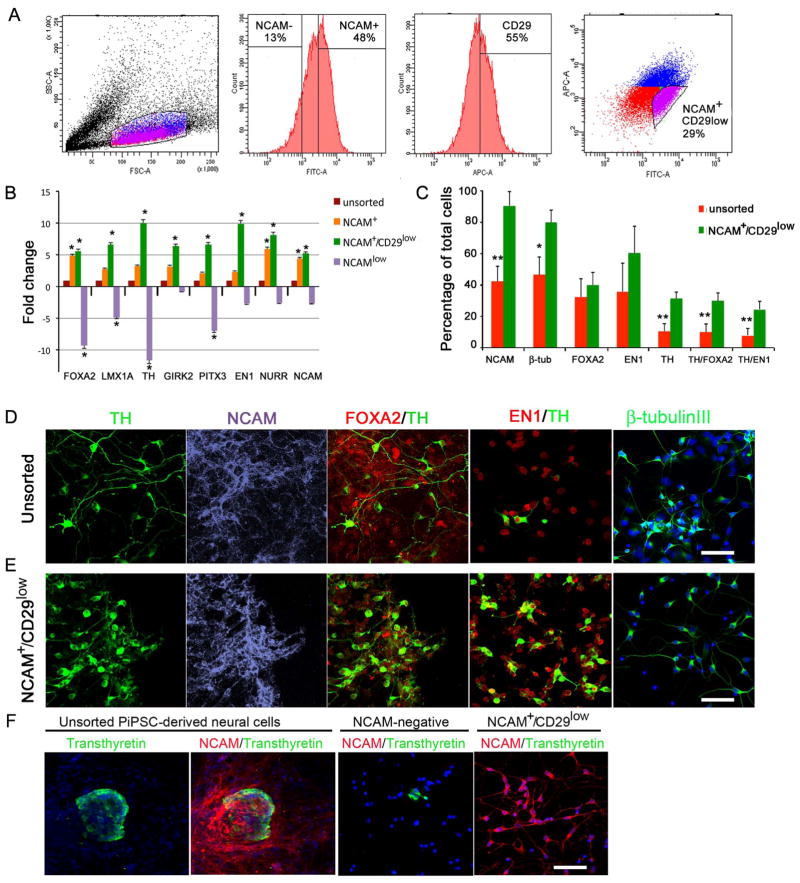
Figure 4. Enrichment of PiPSC-derived DA neurons with cell sorting.
Panel A. Population determination and gating strategy for cell sorting according to SSC/FSC dot plot. Histograms show percentages of NCAM−/+ cells, and CD29+ cells. FITC/APC dot plot shows gating strategy for sorting of NCAM+/CD29low cells according to fluorescence intensity. B. Gene expression analysis with DA-neuron specific markers: FOXA2, LMX1A, TH, GIRK2, PITX3, EN1, NURR1, NCAM. Relative fold change in gene expression of sorted NCAM-, NCAM+ and NCAM+CD29low cells was compared to unsorted cells (=1). C. Percentages of NCAM, β-tubulinIII, FOXA2, EN1, TH, TH/FOXA2, TH/EN1 positive cells in unsorted cell population, NCAM+ and NCAM+/CD29low cell population. Statistical analysis was performed with Kruskall-Wallis test (non-parametric ANOVA) and Dunn’s multiple comparison test between selected pairs. Significant differences between unsorted and sorted NCAM+CD29low cells are presented * p<0.01, ** p< 0.001. Panels D–E. Immunocytochemical characterization of unsorted (D) and sorted NCAM+/CD29low cells (E) with TH, NCAM, FOXA2/TH, EN1/TH and β-tubulinIII staining. Panel F. Unsorted PiPSC-derived neural cells express transthyretin in small cell clusters, and a few transthyretin-positive cells were detected after NCAM-negative sorting. NCAM+/CD29low cells were negative for transthyretin. Scale bar 50 μm.

