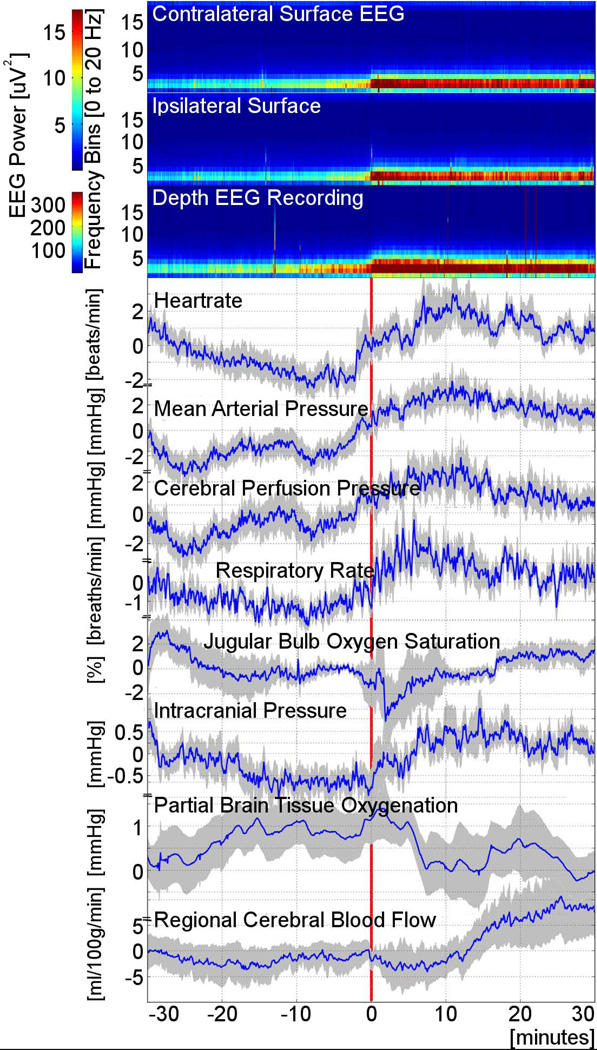
Figure 2.
Grouped data of physiologic changes associated with the onset of intracortical seizures. Spectrograms (upper three panels) displayed as relative changes on a group level, demonstrate increases in EEG power predominantly in the 2–5 Hz frequency range, first seen in the minidepth EEG recording (third panel from top) followed by contra- (top panel) and ipsilateral scalp (second panel from top) recordings. Spectrograms reveal clear changes in EEG power recorded both form the minidepth as well as the scalp, which precedes the seizure onset determined by visual inspection of raw EEG tracings (indicated as “0” on the x-axis and by the vertical red line). Physiology recordings: Timing of increases in cardiovascular (heart rate, mean arterial pressure) and respiratory (respiratory rate, minute ventilation [not shown]) parameters coincides with detection of first intracortical spectral power changes, while rising intracranial pressure is only detected later when seizures become recognizable on inspection of the raw EEG. Global brain metabolism increases sharply for a short time as suggested by the transient drop in jugular bulb oxygenation (approximately 2 minutes after seizure onset). This lasts for several minutes followed by gradual return to pre seizure baseline global metabolism (approximately 8 minutes after seizure onset). There is a small drop of partial brain tissue oxygenation starting 5 minutes after seizure onset. While cerebral perfusion pressure rises with increase in mean arterial pressure at the time the first spectrogram changes are recognizable on the minidepth recording, there is a very delayed increase in regional cerebral blood flow seen starting about 10 minutes after seizure onset. Physiology graphs are displayed as means (blue lines) with one standard error of the mean (shaded area).

