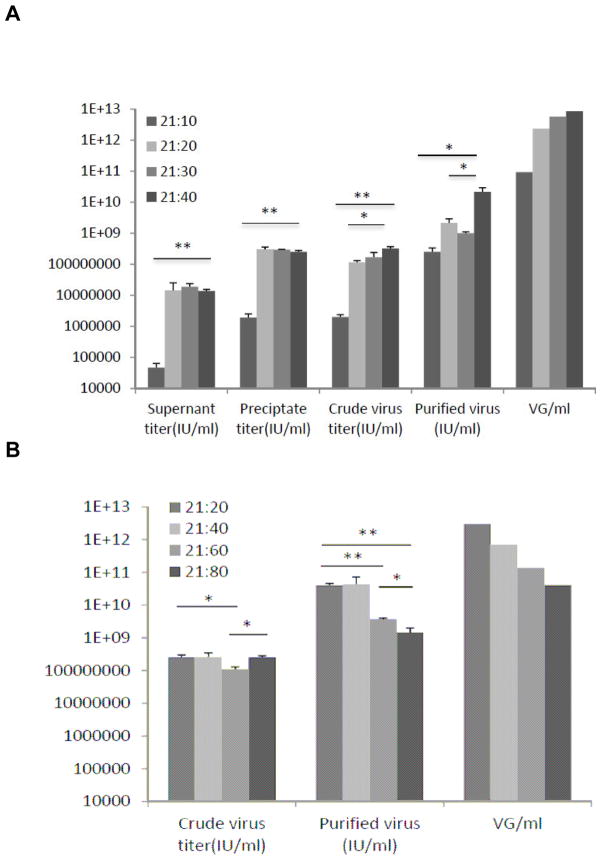
Figure 2. Differential effects on AAV2 titer of various N/P ratios.
(A): Effect of N/P ratios 10, 20, 30 and 40 on supernatant, precipitate, crude, purified mean Infectious unit titers (IU/ml) and the mean vector genome titers (VG/ml) of purified virus. The same DNA amount of 21 ug/15cm dish (or 1.05 ug/ml of media) was employed throughout. (B) Effect of N/P ratios 20, 40, 60 and 80 on crude and purified mean Infectious unit and mean vector genome titers of purified virus. The same DNA amount of 21 ug/15cm dish (or 1.05 ug/ml of media) was employed throughout. Crude and purified infectious unit titers were performed in triplicate, whereas genomic titers (VG/ml) was performed once per group. Bars show mean value ± sem.

