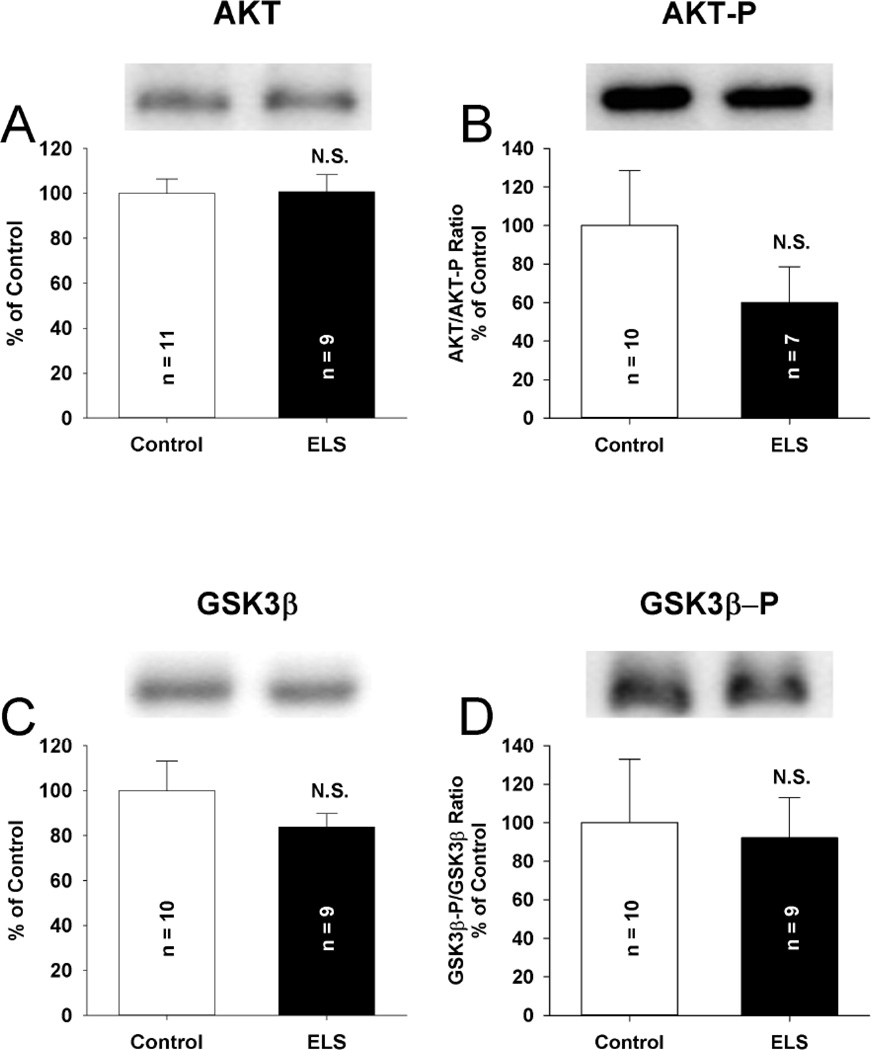
Figure 6. Total expression of LTD linked kinases is unchanged following ELS at P60.
No alterations were observed in the total expression of AKT (A) (ELS: 100.63 ± 7.72%, n = 9, control: 100.00 ± 6.48%, n = 11, P = NS, Student’s t-tests) or phosphorylated Akt (Ser 473) (B) (ELS: 60.07 ± 18.5%, n = 7 control: 100 ± 28.51%, n = 10, P = NS, Student’s t-tests) following ELS compared to controls. No alterations were observed in the total expression of GSK3β (C) (ELS: 83.70 ± 6.09%, n = 9, control: 100.00 ± 13.15%, n = 10, P = NS, Student’s t-tests) or phosphorylated GSK3β (Ser 9) (D) (ELS: 92.21 ± 20.72%, n = 9, control: 100.00 ± 32.93%, n = 10, P = NS, Student’s t-tests) following ELS compared to controls. Semi-quantitative western-blot technique(Cornejo et al., 2007) was used to determine immunoreactivity/mg loaded protein, which were normalized to controls (see Methods). Typical blots with equivalent protein loading shown. Solid bars ELS, open bars control.

