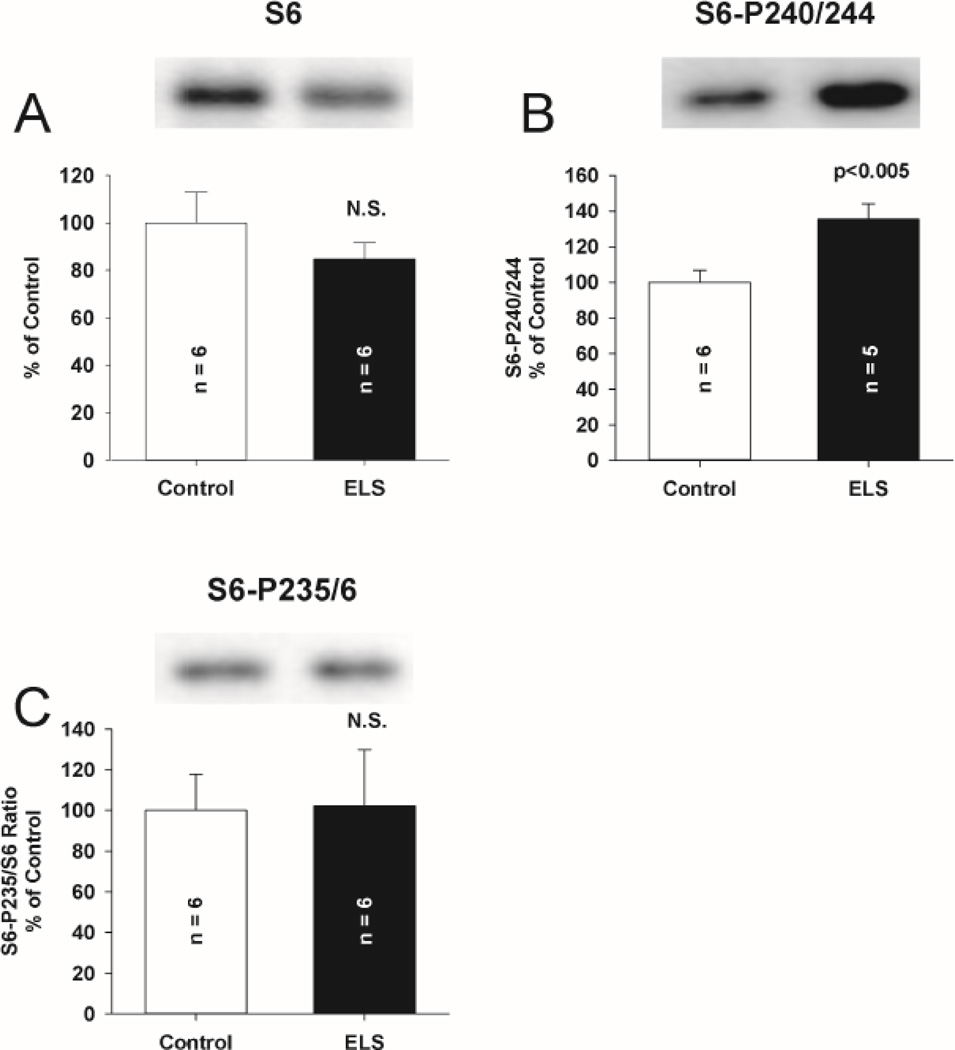
Figure 8. Expression of translational kinase S6 and selected phosphorylated isoforms following ELS at P60.
A, Total expression of S6 was not affected by ELS compared to control (ELS: 84.78 ± 6.74%, n = 6, control: 100.00 ± 12.83%, n = 6, NS, Student’s t-tests). Expression of phosphorylated S6 isoform (B), Ser 240/244 was significantly elevated by ELS (ELS: 135.32 ± 8.81%, n = 5, control: 100.00 ± 6.69%, n = 6, P <0.005, Student’s t-tests). Expression of phosphorylated isoform Ser 235/236 (C) was not altered by ELS (ELS: 102.3 ± 27.48%, n = 6, control: 100.00 ± 17.84%, n = 6, P = NS, Student’s t-tests). Semi-quantitative western-blot technique(Cornejo et al., 2007) was used to determine immunoreactivity/mg loaded protein, which were normalized to controls (see Methods). Typical blots with equivalent protein loading shown. Solid bars ELS, open bars control.

