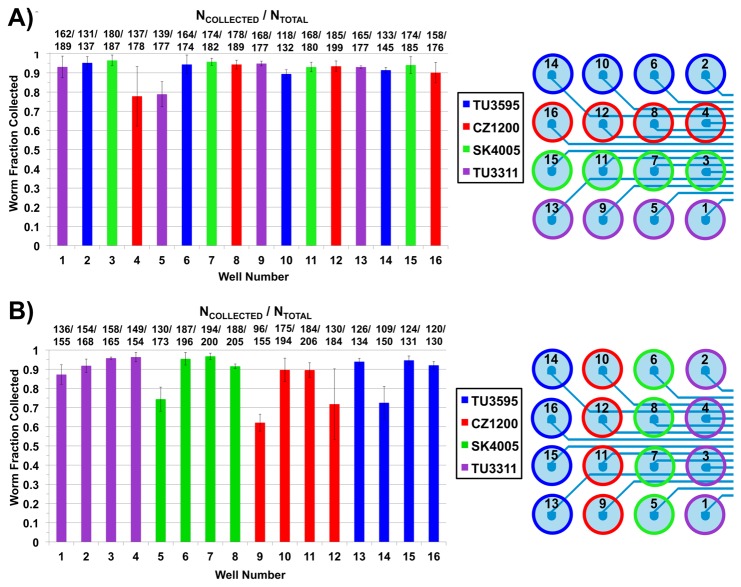
Figure 4. Population mixing eliminated during automated delivery at 20 psi (~138 kPa).
The graphs show the fraction of animals collected after delivery from a given well that are of the same strain initially loaded into the well. The actual average number of collected worms over the average number of those initially loaded is indicated above each bar. A) Four distinct strains loaded in each row. B) Four distinct strains loaded in each column. A corresponding color-coded schematic on the right of both graphs indicates into which wells the strains were loaded at the beginning of both experiments. Each color represents a single type of strain.

